In Part 1 we discussed the basal mechanisms as transport of ions across the cell membrane and how electrical signals are generated, and recorded and processed by the ECG recorder. Part 2 presented the normal components of the ECG, and how they are influenced by pathological and pathophysiological conditions. In this Part 3 we shall discuss how various clinical situations impact upon the entire ECG.
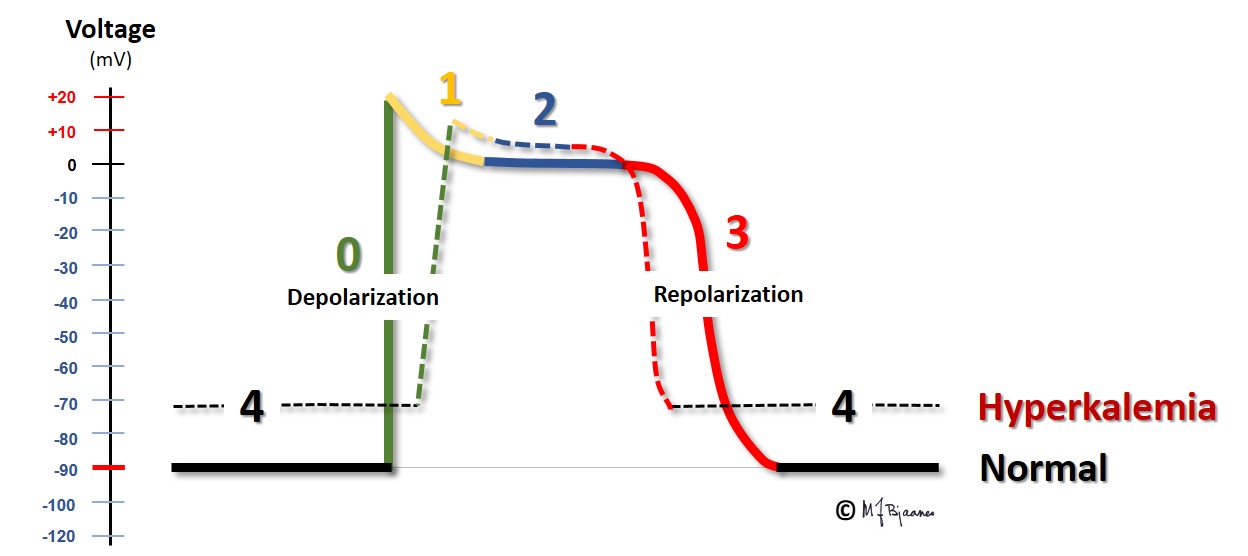
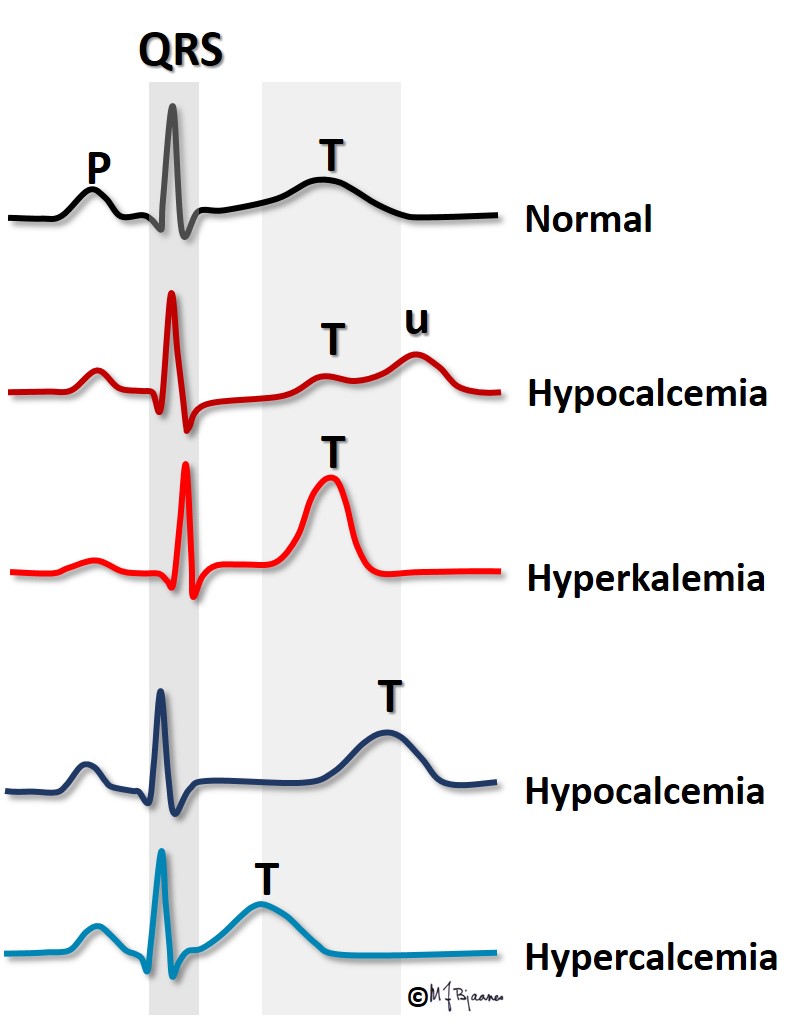
The ratio between the potassium concentration inside and outside the cells is the main factor responsible for the magnitude of the resting membrane potential. For this reason even a small change in extracellular potassium concentration may be important. In hyperkalemia the transmembrane difference in potassium concentration is reduced, and the resting membrane potential is less negative than normally. Then the depolarization velocity is reduced (lower dV/dt), and impulse conduction retards, or may even stop (then it is blocked). In hypokalemia the situation is the opposite: the transmembrane potassium gradient is larger than normal, and the resting membrane potential becomes more negative. Counterintuitively, this reduces outward potassium current, but the explanation is that the potassium channel function is influenced by the extracellular potassium concentration, and slowing the repolarization prolongs the action potential.
In ischemia/infarction the energy-consuming ion pumps fail. The local extracellular concentration of K+ will increase, the transmembrane potassium gradient decreases, as does the resting membrane potential, and the action potentials shorten in the affected area. Whenever there is a difference in electrical potential between adjacent areas, a current of injury is generated, and when in addition, impulse conduction is heterogeneous, arrhythmias may easily arise. More on this in part 4, arrhythmias.
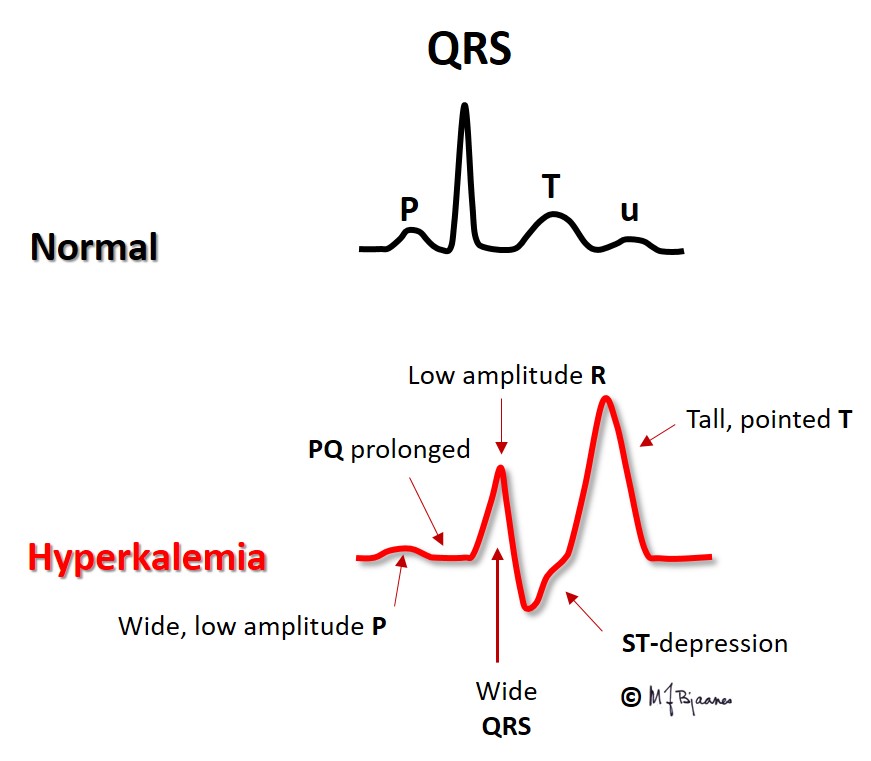
Hyperkalemia is most often encountered in renal failure (uraemia), diabetic ketoacidosis and in patients who use drugs that inhibit the aldosterone – angiotensin system. The figure shows that the action potential now takes off from a less negative membrane potential, and rises slower, has a short plateau (phase 2) and an earlier repolarization (phase 3).
Due to the less negative resting membrane potential, impulse conduction velocity is reduced, and we see that the
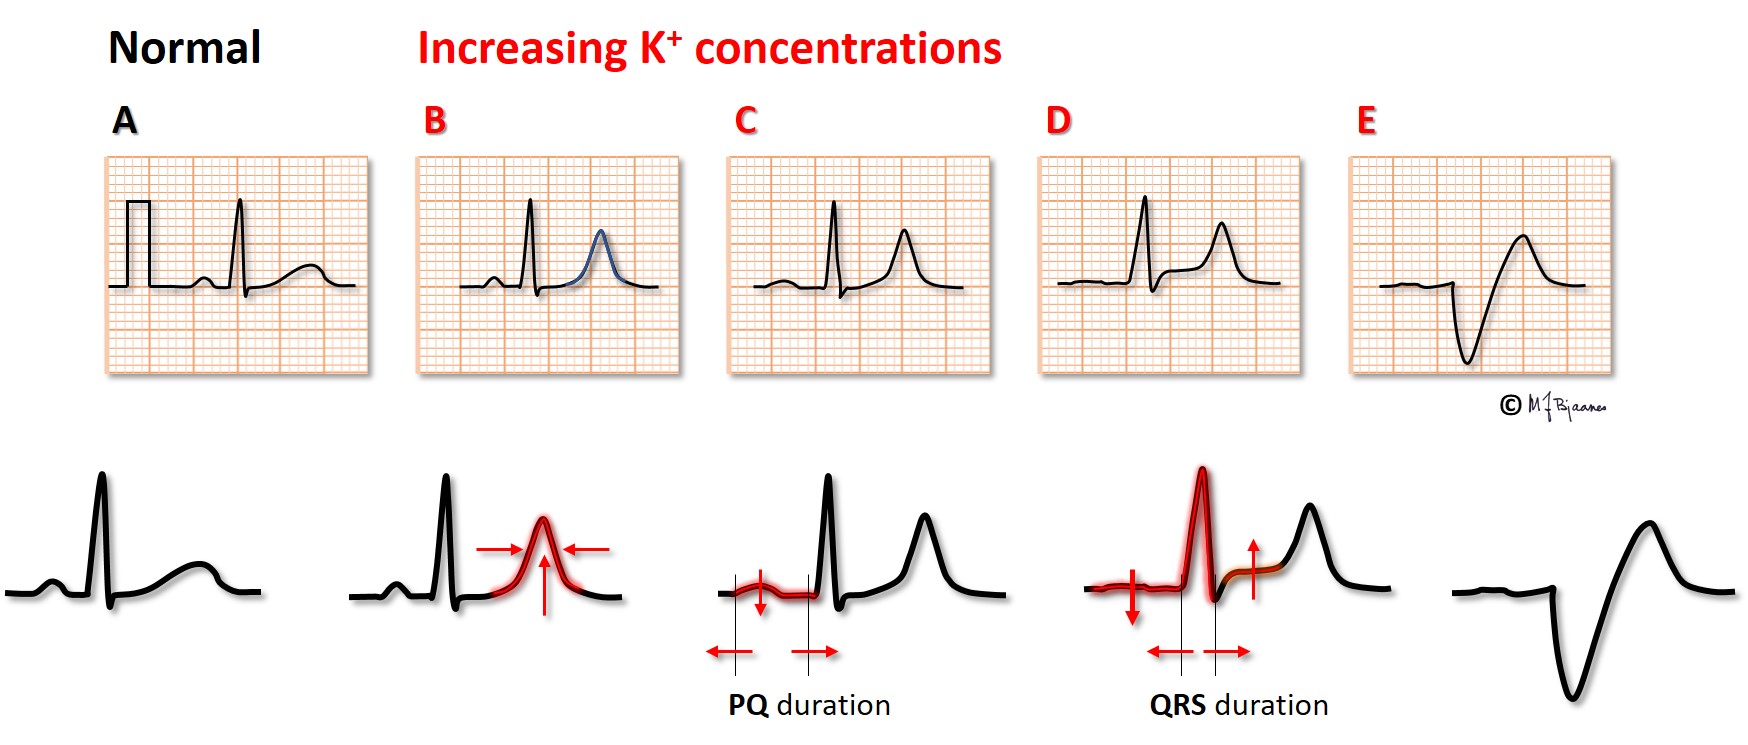
When s-K+ is extremely high, the P waves may disappear without any escape rhythm. In open heart surgery cardiac arrest is often induced by infusion of a cardioplegic solution with a high potassium content.
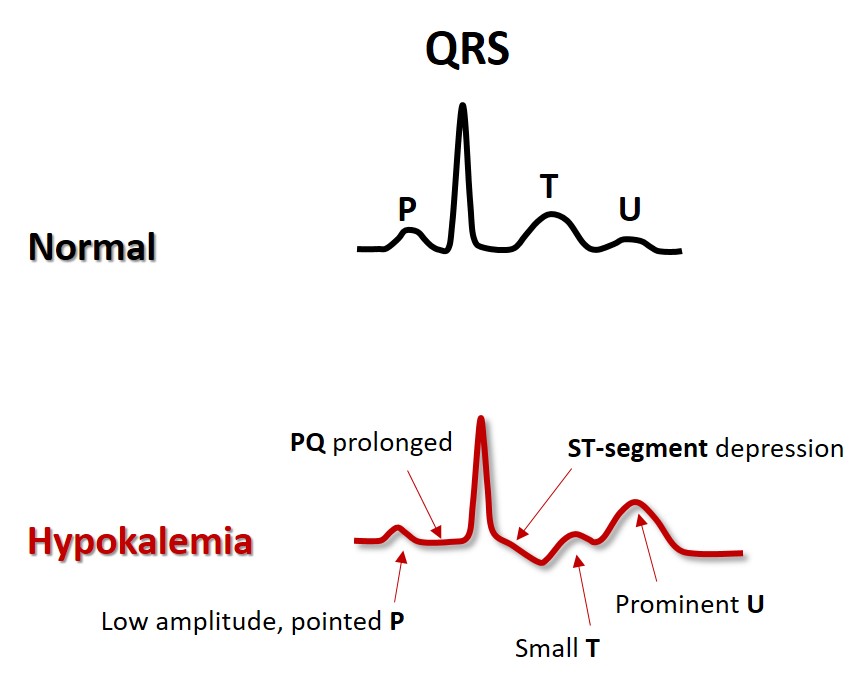
Hypokalemia may be seen in patients who use diuretic drugs without sufficient replacement of potassium from diet or drug, in diarrhea, adrenal disease and in too vigorous treatment of diabetic ketoacidosis. Often they suffer from simultaneous magnesium deficiency. The low extracellular K+ concentration results in hyperpolarized myocytes (more negative membrane potential). Impulse conduction is fast, but the repolarization is slower due to a (paradoxically) reduced potassium channel conductance. The action potential is prolonged, as reflected by the increased QT time. There is increased risk of arrhythmias, both because hyperpolarized myocytes are easily activated by impulses from neighbor cells, and also because a long action potential predisposes to cellular triggered activity/automaticity (more in Part 4 ). In clinical emergency settings infusion of potassium and magnesium may sometimes reduce the arrhythmias and stabilize the situation.
Whereas s-potassium concentration influences both the T wave amplitude and the duration of the action potential (and thus the QT interval), s-Ca2+ concentration mainly influences the QT time.
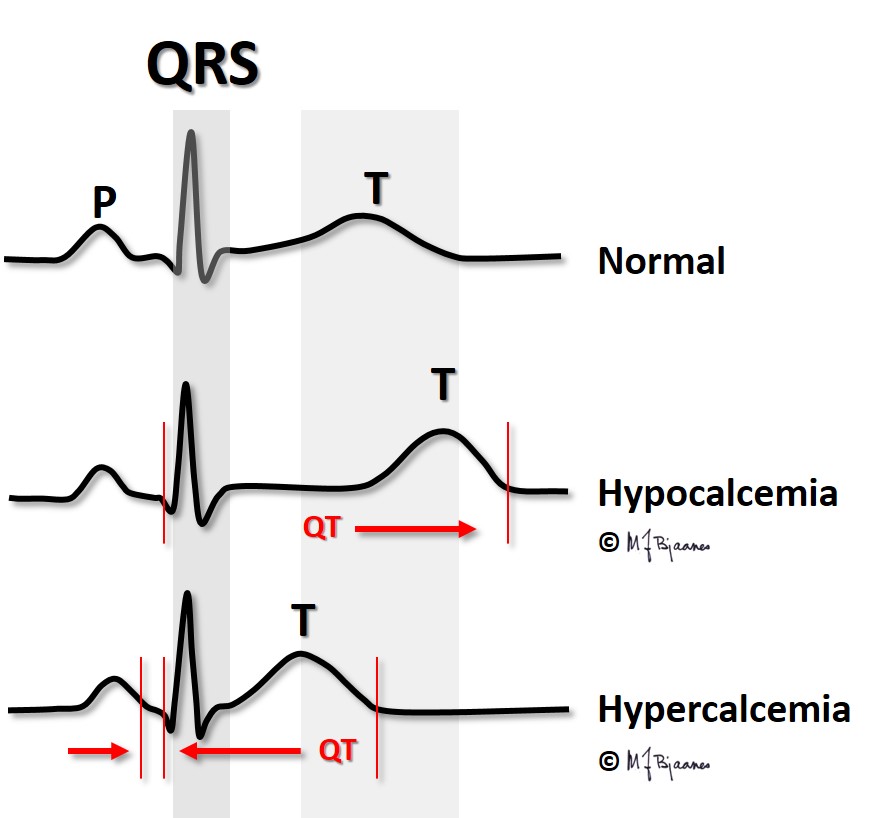
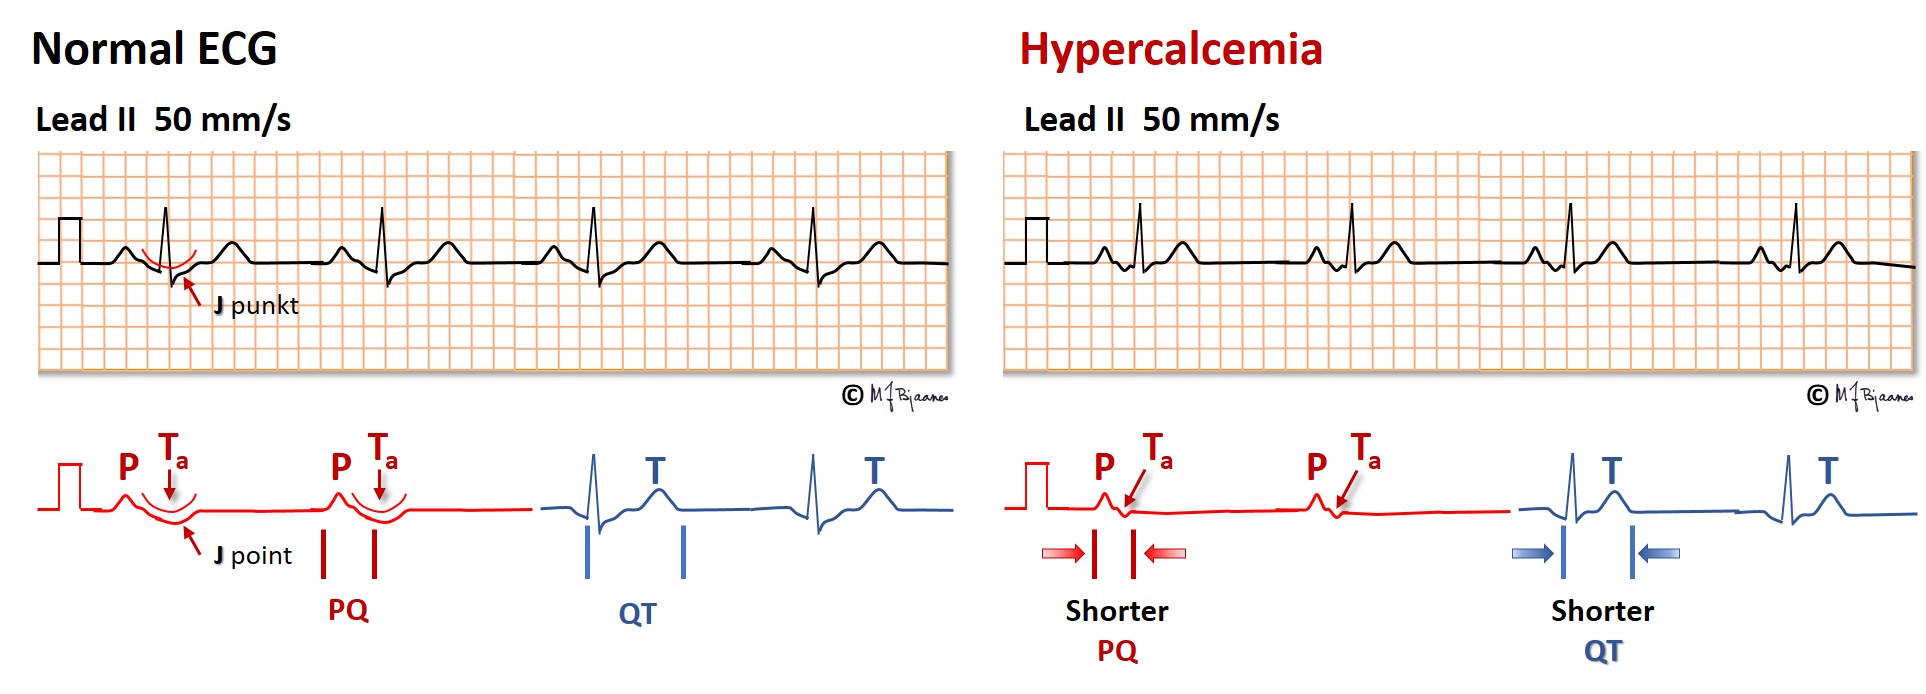
Hypercalcemia occurs when the parathyroid glands are overactive, and occasionally in cancer with skeletal metastases. In hypercalcemia the QT interval is short; in fact, in a patient with large changes in s-Ca2+, the QT time can provide a rough estimate of the present s-Ca2+ concentration.
Also the atrial action potential shortens in hypercalcemia, occasionally to such a degree that the atrial T wave, Ta, becomes visible even in front of the QRS.
Hypocalcemia occurs when the parathyroid glands fail, and in vitamin D deficiency. The QT interval is then prolonged, predisposing for arrhythmias (discussed in Part 4).
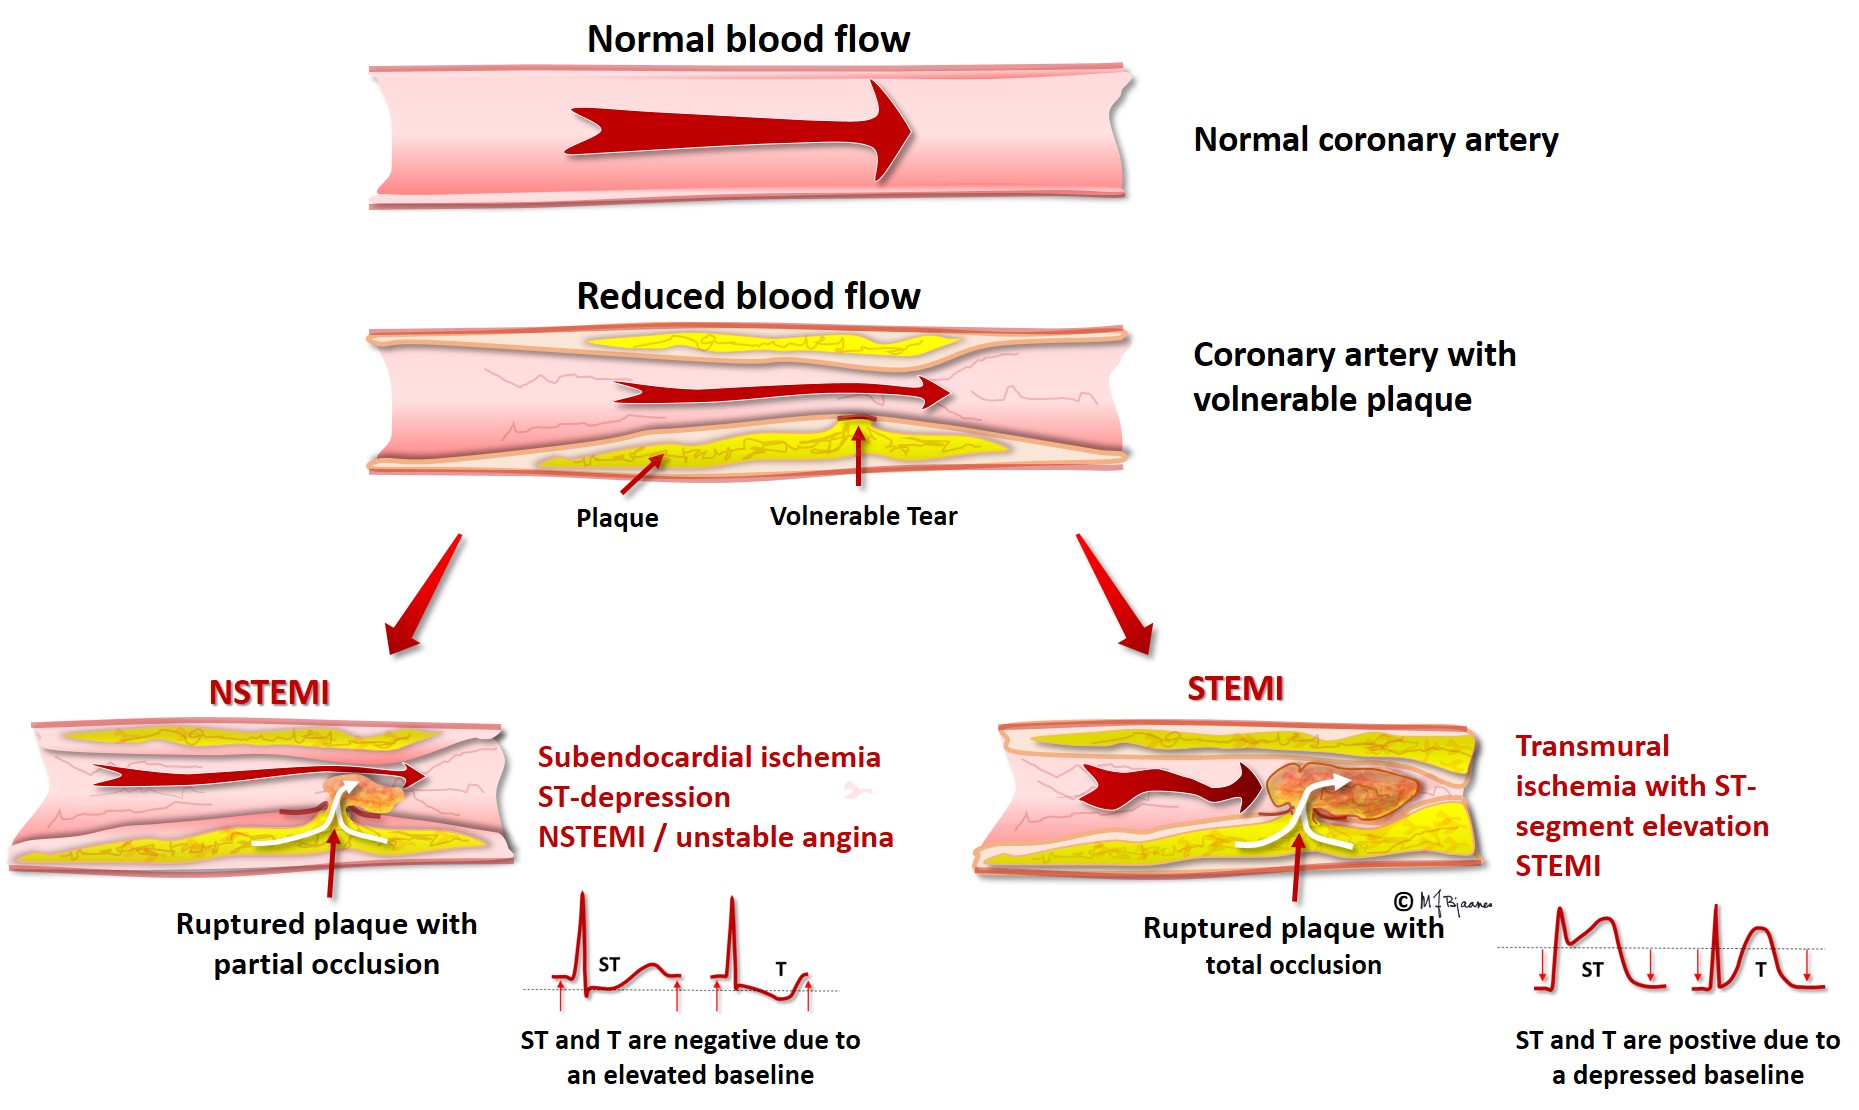
Ischemia results in energy deficiency, and the energy-requiring ion pumps fail. The ATP driven Na+/K+ pump is very important, and ischemia further results in a leaky cell membrane that permits sodium entry (see Part 2). The resting membrane potential becomes less negative than that of the non-ischemic neighbor cells, and a diastolic current of injury is generated, directed from the ischemic cells toward the non-ischemic, more negatively charged healthy areas. When the entire myocardial wall from endo- to epicard is ischemic (transmural ischemia), the current of injury points away from the ECG electrodes located above the ischemic area, resulting in a negative deflection in ECG. Thus the diastolic baseline (the TP segment) moves downward. In the main part of systole, however, the ischemic and non-ischemic myocytes are all fully depolarized, and there is no current of injury, and the QRST is not depressed. When we look at an ECG, we cannot see where the baseline should have been located; we only see that the QRS-T complex rises above the depressed baseline. This is called ST elevation. As the current of injury is directed toward the healthy neighbor areas, an ECG electrodes there will record a positive current that lifts the baseline. Now the QRST seems to be depressed, and remote ischemia thus results in reciprocal ST depression. We must underscore that ST elevation or depression are not synonymous with threatening cell death: often in heart disease, permanent ST-deviations are seen. Ischemia is usually a transient phenomenon, and ischemic ST deviations are thus dynamic. Cell necrosis occurs only when ischemia persists, but recent onset ST deviation is a warning signal that immediately should trigger diagnostic and therapeutic measures. ST elevation myocardial infarction (STEMI) is usually caused by a thrombotic occlusion of an epicardial coronary artery (see figure below), but coronary artery spasms may also induce such ECG changes in so-called variant angina (Prinzmetal’s angina), a disease that preferentially occurs in young female tobacco smokers.
Angina pectoris is a clinical (and not a pathophysiological) diagnosis, typically characterized by exercise related chest pain that leaves at rest and by nitroglycerin. Most cases are ischemic, with transient ECG changes during the pain episodes. Patients may, however, suffer from clinical angina without detectable ischemia, and often, painless ST changes can also be seen (silent ischemia).
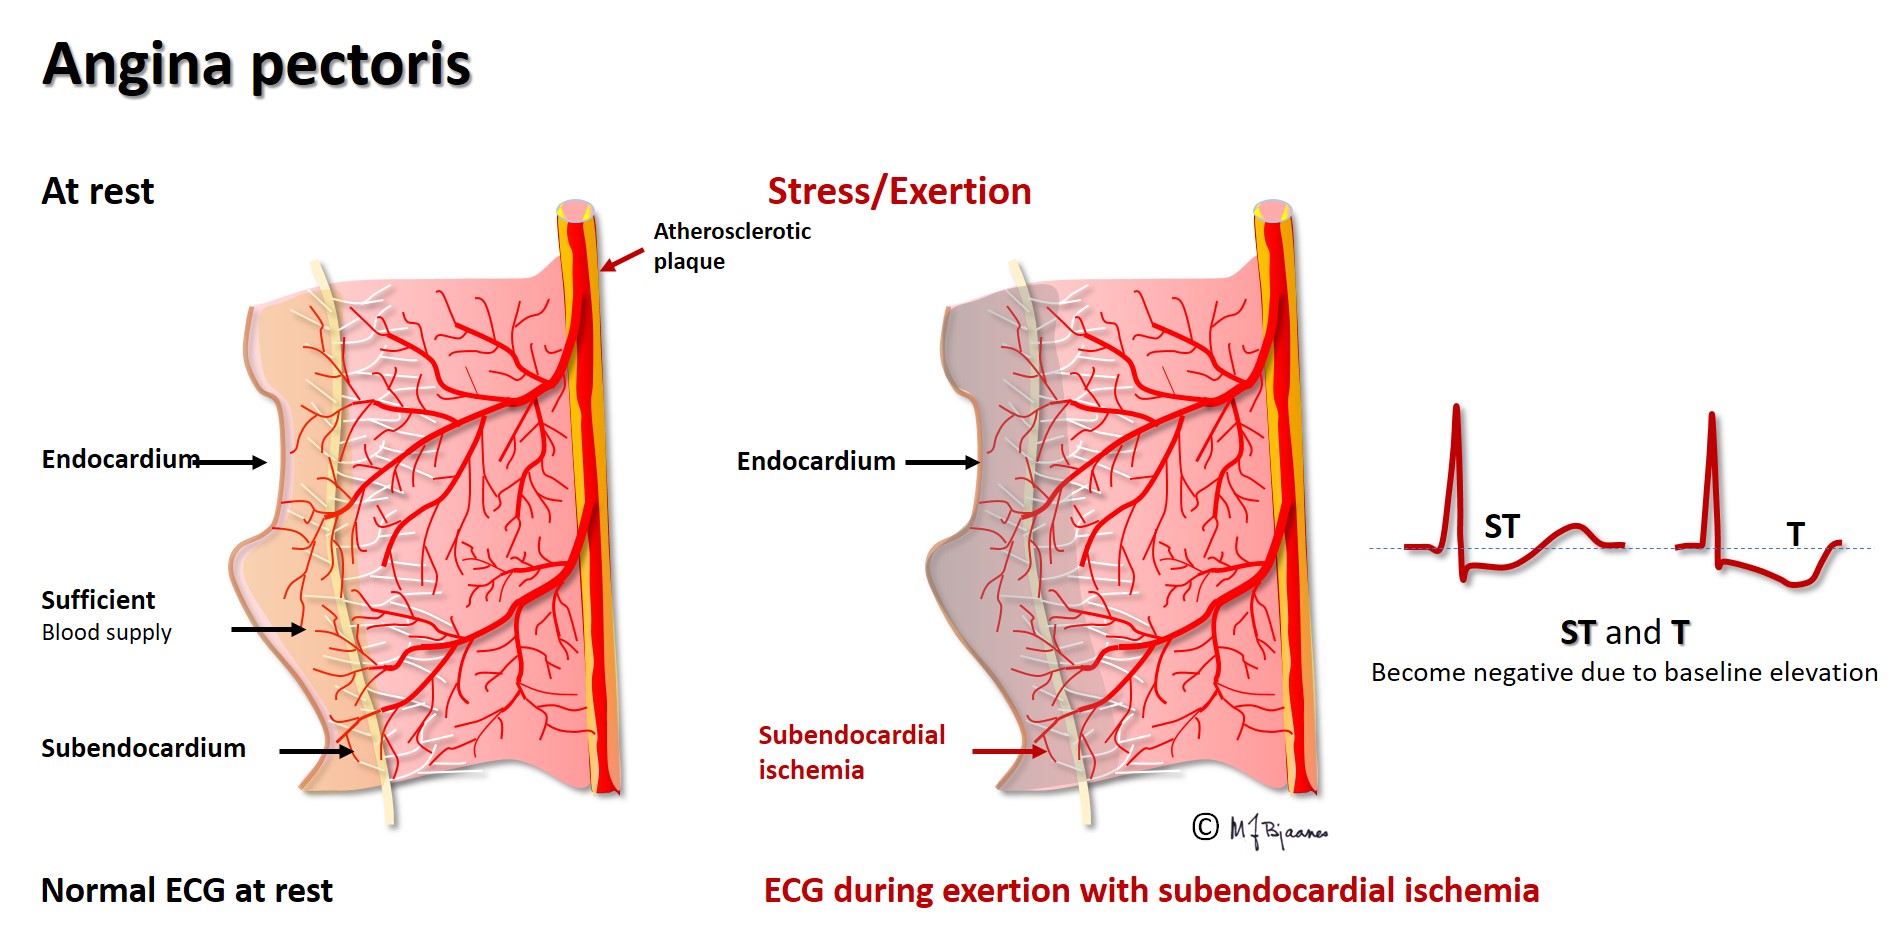
The main coronary arteries are located outside the cardiac muscle, thus avoiding compression in systole. Their branches take a perpendicular course across the myocardial wall, and if the perfusion pressure is reduced, the most distant myocytes, those near endocard, are the first ones to suffer from ischemia. When the ischemia is subendocardial, the cells here have a less negative resting membrane potential compared to epicardial cells and those in the surrounding tissue. The diastolic current of injury is then directed toward epicardium, and hence will be seen as an ST depression both in the ECG leads above the site and in a wider area. Such subendocardial ischemia can be provoked by exercise (as in an exercise ECG test) when a coronary artery is stenotic. The changes are usually best seen in the chest leads V3-V6, but unfortunately, ST depression cannot be used to identify the culprit artery. ST depression is also often seen in non-ST-elevation myocardial infarction, NSTEMI, where an epicardial artery is partly occluded, with cell death limited to the deeper muscle layers.
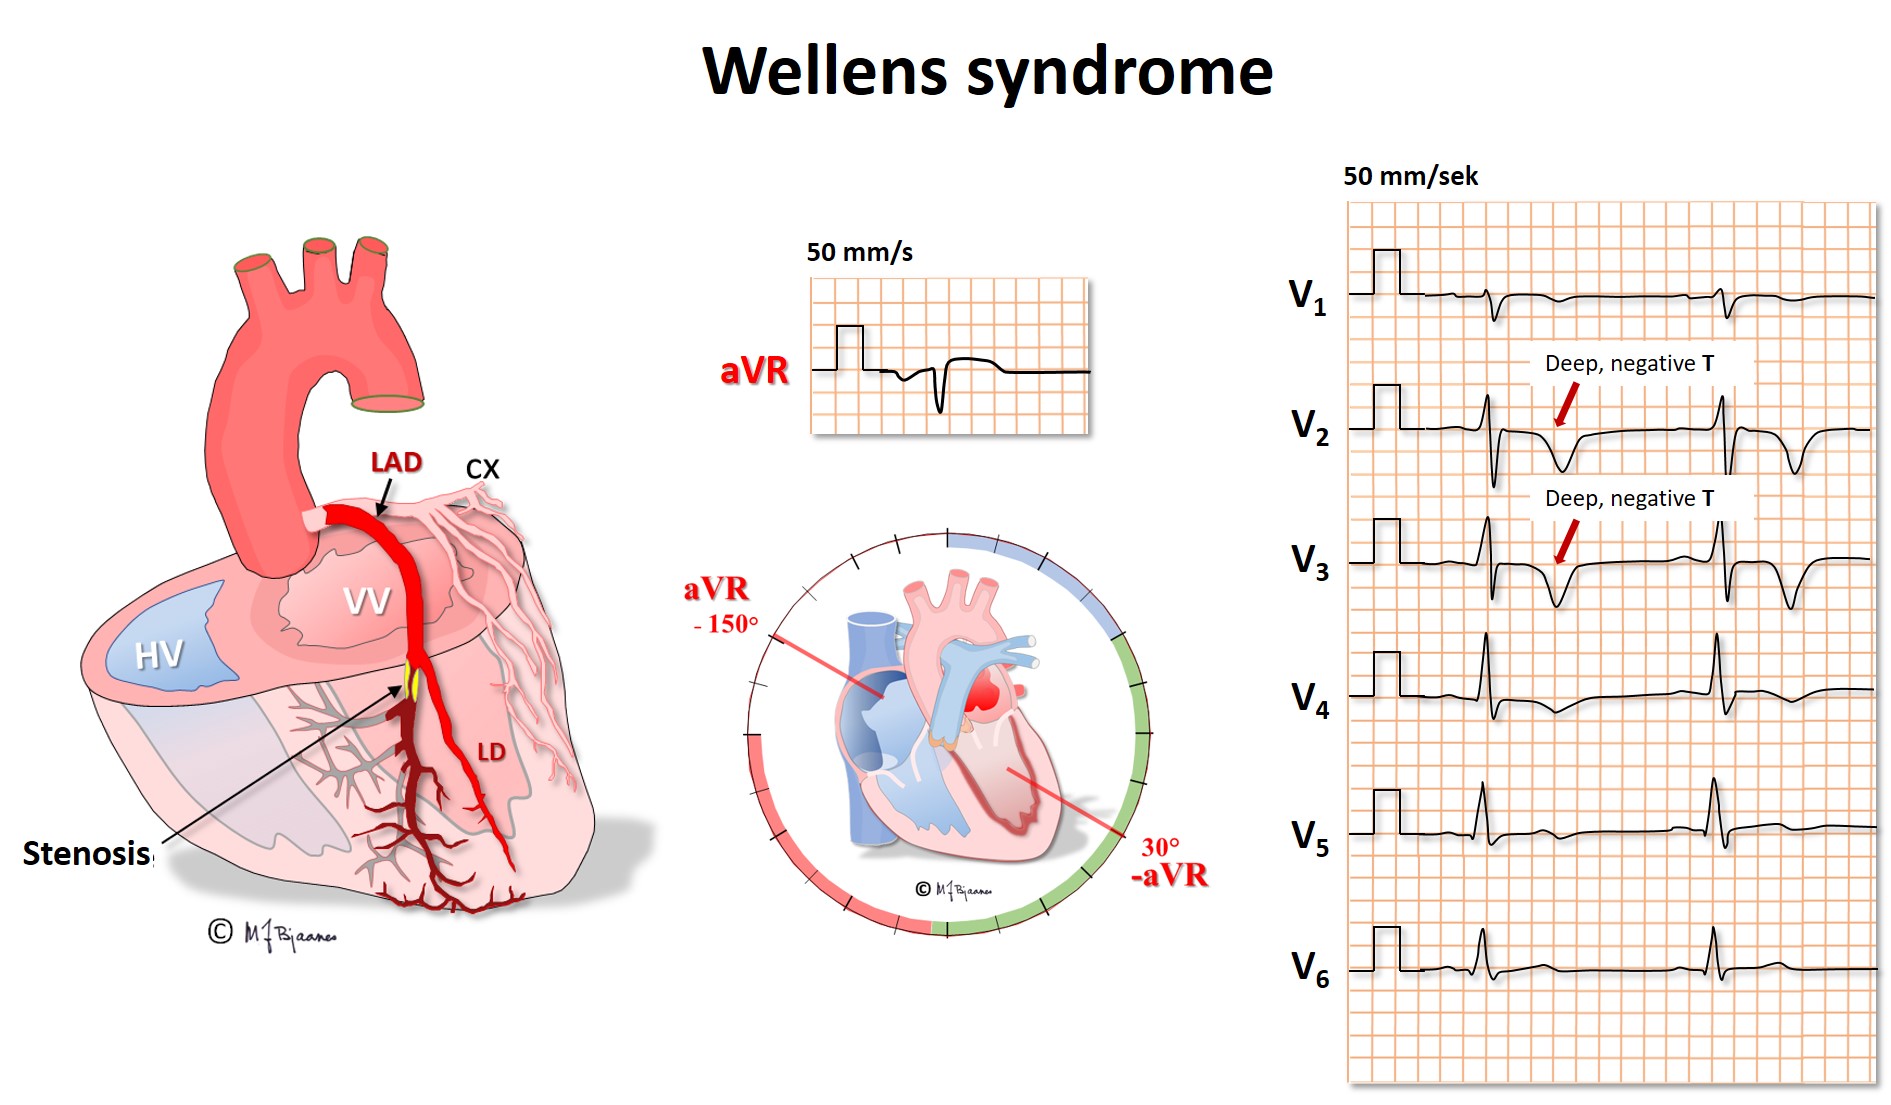
The lead aVR is peculiar because it «looks at» the heart from above, into the ventricles at all directions. The normal myocardial activation is always from endo- to epicardium, pointing away from the lead. Thus there should not be a distinct r wave in aVR (and no q wave in minus aVR). When the left anterior descending coronary artery (LAD) has a proximal critical stenosis, a first sign may be inverted, deep and symmetric precordial T waves in V2-V4. There is no marked ST elevation because the current of injury spreads in many directions, however, the disturbed repolarization causes the characteristic T waves (Wellen’s syndrome). This ECG sign is a signal of a threatening large anterior wall infarction, and chest pain patients with this pattern should immediately be brought to the cath lab for intervention.
Ischemia almost immediately results in impaired relaxation of the affected myocard (diastolic dysfunction), and a current of injury evolves, as reflected by ST elevation or depression in at least two neighbor leads. If ischemia persists, cells will become injured (troponin release) and eventually die (myocardial infarction).
In leads that oppose the ischemic area, reciprocal changes in STT are often seen. No lead is located on the posterior wall of the heart, so no ST elevation is seen in ischemia here, but mirror changes in the anterior wall – ST depressions – are frequently seen in the precordial leads V2-V4, just like those that can be seen in anterior wall subendocardial ischemia.
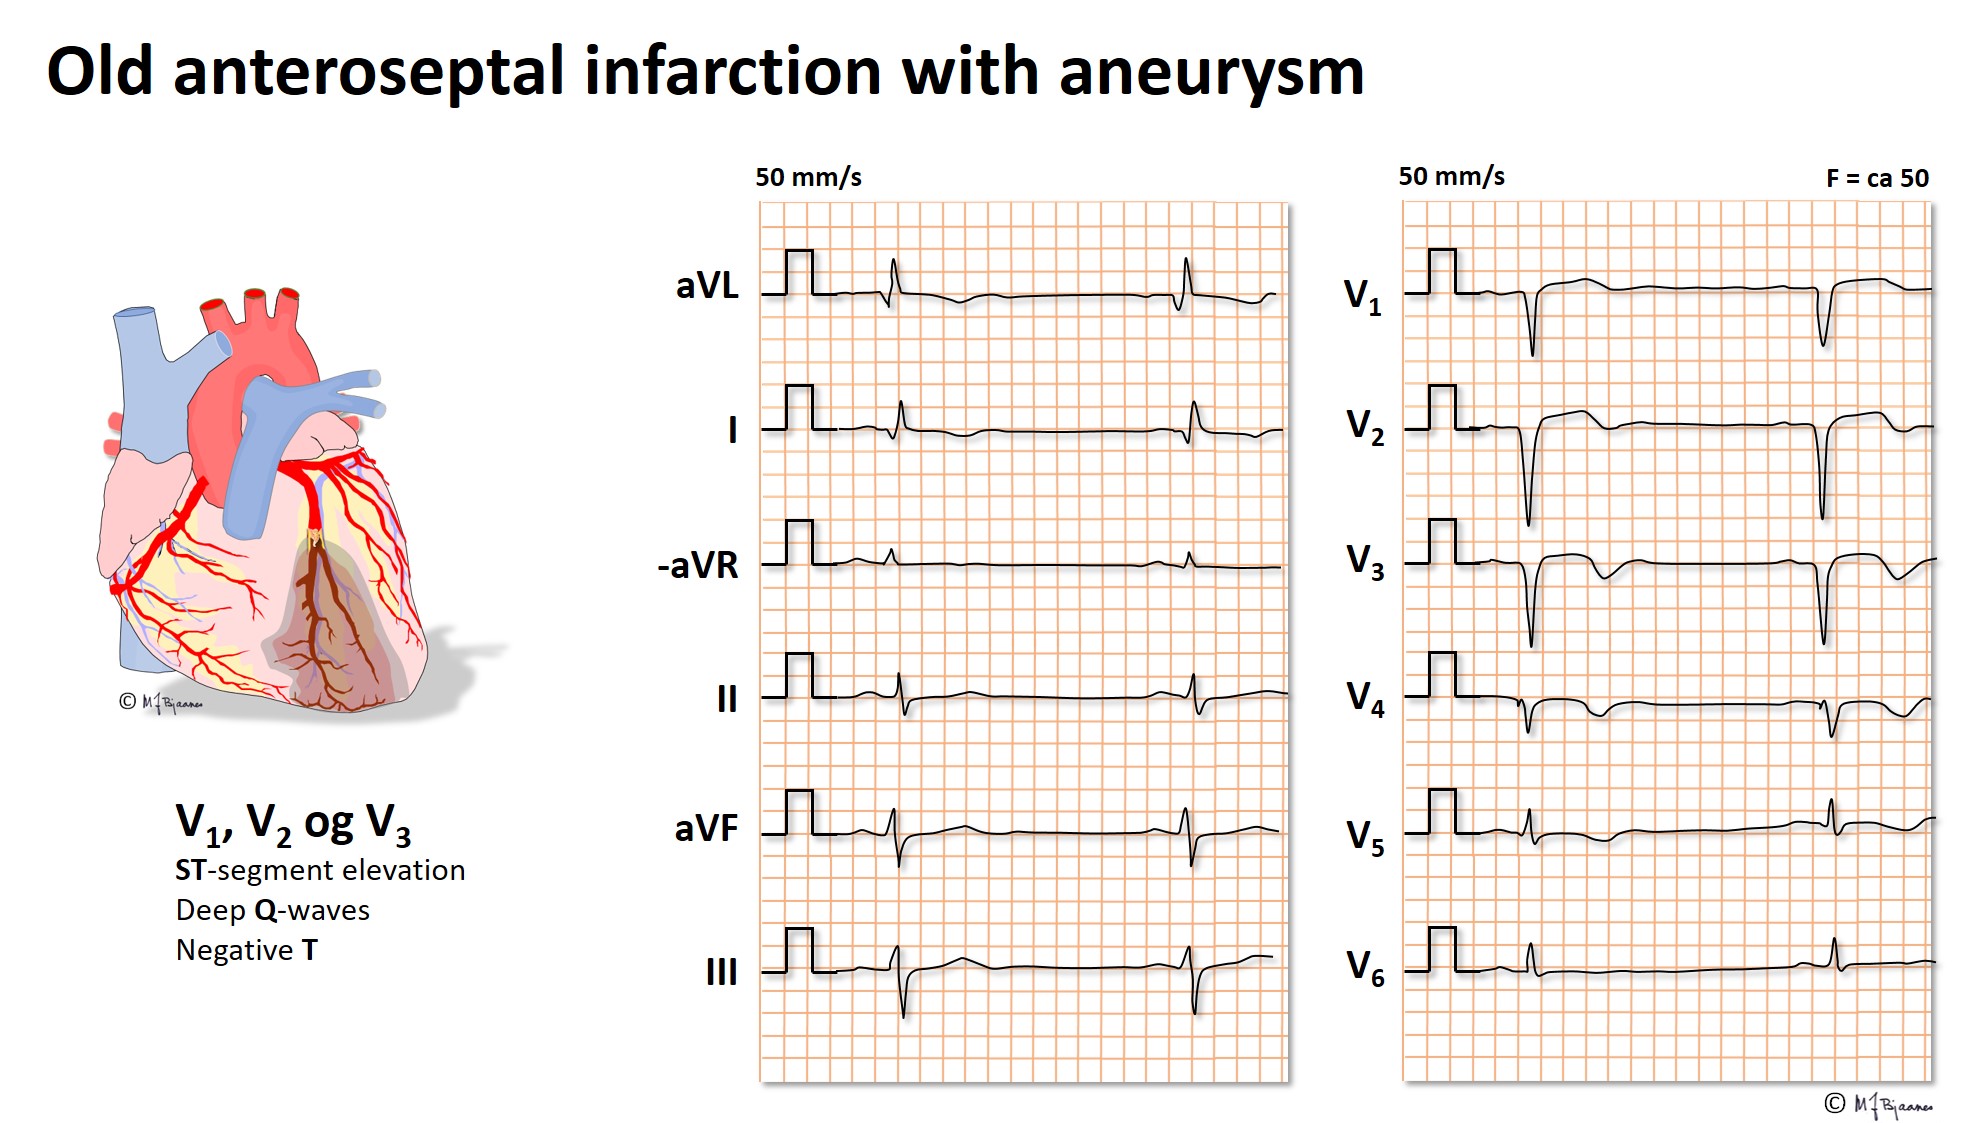
Dead cells have no electric activity, and current is directed away from leads on the infarction area; we see pathological q waves or abnormally low R waves, in addition to inverted T waves. Ischemia and myocardial necrosis (infarction) thus have many different ECG expressions. Occasionally the electrical infarction signals may be balanced, and even result in an almost normal ECG.
With time, the ECG changes in STEMI usually follow a regular course: The first sign may be a slight repolarization disturbance, seen in the T waves (B). Then follows ST elevation (C), followed by the development of pathological Q waves (D) and T wave inversion (E). Now the ST elevation tapers off, the R wave may be reduced, while the Q wave and T wave inversion evolves further (F). When the process is over, as in an «old STEMI» (days to years), we usually see pathological Q waves/ reduced R waves and often inverted T waves in the infarct area EE).

The cause of STEMI is usually a sudden thrombotic occlusion of a large (epicardial) coronary artery, and as long as there is deviation of the ST segment, at least some of the ischemic myocytes are still alive, and potentially may be rescued by reperfusion (thrombolysis or PCI). Patients with ongoing chest pain and recent onset ST elevation must as soon as possible, receive revascularization treatment, even if several hours have passed since the onset of pain, as there may have been interspersed periods with some perfusion, prolonging the therapeutic time window.
The forth universal definition of myocardial infarction (2018) states that in the proper clinical context, new ST segment elevations (measured at the J-point) are considered suggestive of ongoing coronary acute occlusion when at least two contiguous leads show ST segment elevation in the absence of left ventricular hypertrophy or left bundle branch block, ≥1 mm in the other leads than V2-V3. For V2-V3 the threshold is ≥2.5 mm in men <40 years, ≥2 mm in men ≥40 years, and ≥1.5 mm in women.
New horizontal or downsloping ST depression ≥0.5 mm in two contiguous leads and/or T inversion >1 mm in two contiguous leads with prominent R wave or R/S ratio >1.
ECG from an electrode just above the ischemic area, will show ST elevation, and thus the ST vector (axis) will point to the area of injury in a STEMI. The pattern of leads with ST elevation thus permits a qualified assumption on which artery is the culprit one. This knowledge is important for the operator in the cat lab, because the culprit artery needs immediate opening, and, if there are other stenoses, these may be treated afterwards or later on. The sum of ST elevation in millimeter in all 12 ECG leads, gives a rough estimate of the area at risk. Location, size of area at risk and time in pain before revascularization all together give a good prediction of the clinical course in short and long term.
Infarction localization based upon ST elevations:


REMEMBER: An ECG recorded early in the course of an infarction may be normal. When the clinician strongly suspects an infarction, albeit the initial ECG is normal, repeated recordings should be obtained at ½ an hour’s intervals for a couple of hours. Infarction related ECG changes occasionally develop over time.
REMEMBER: Compare recent ECG with previous ones when possible (without waste of time).
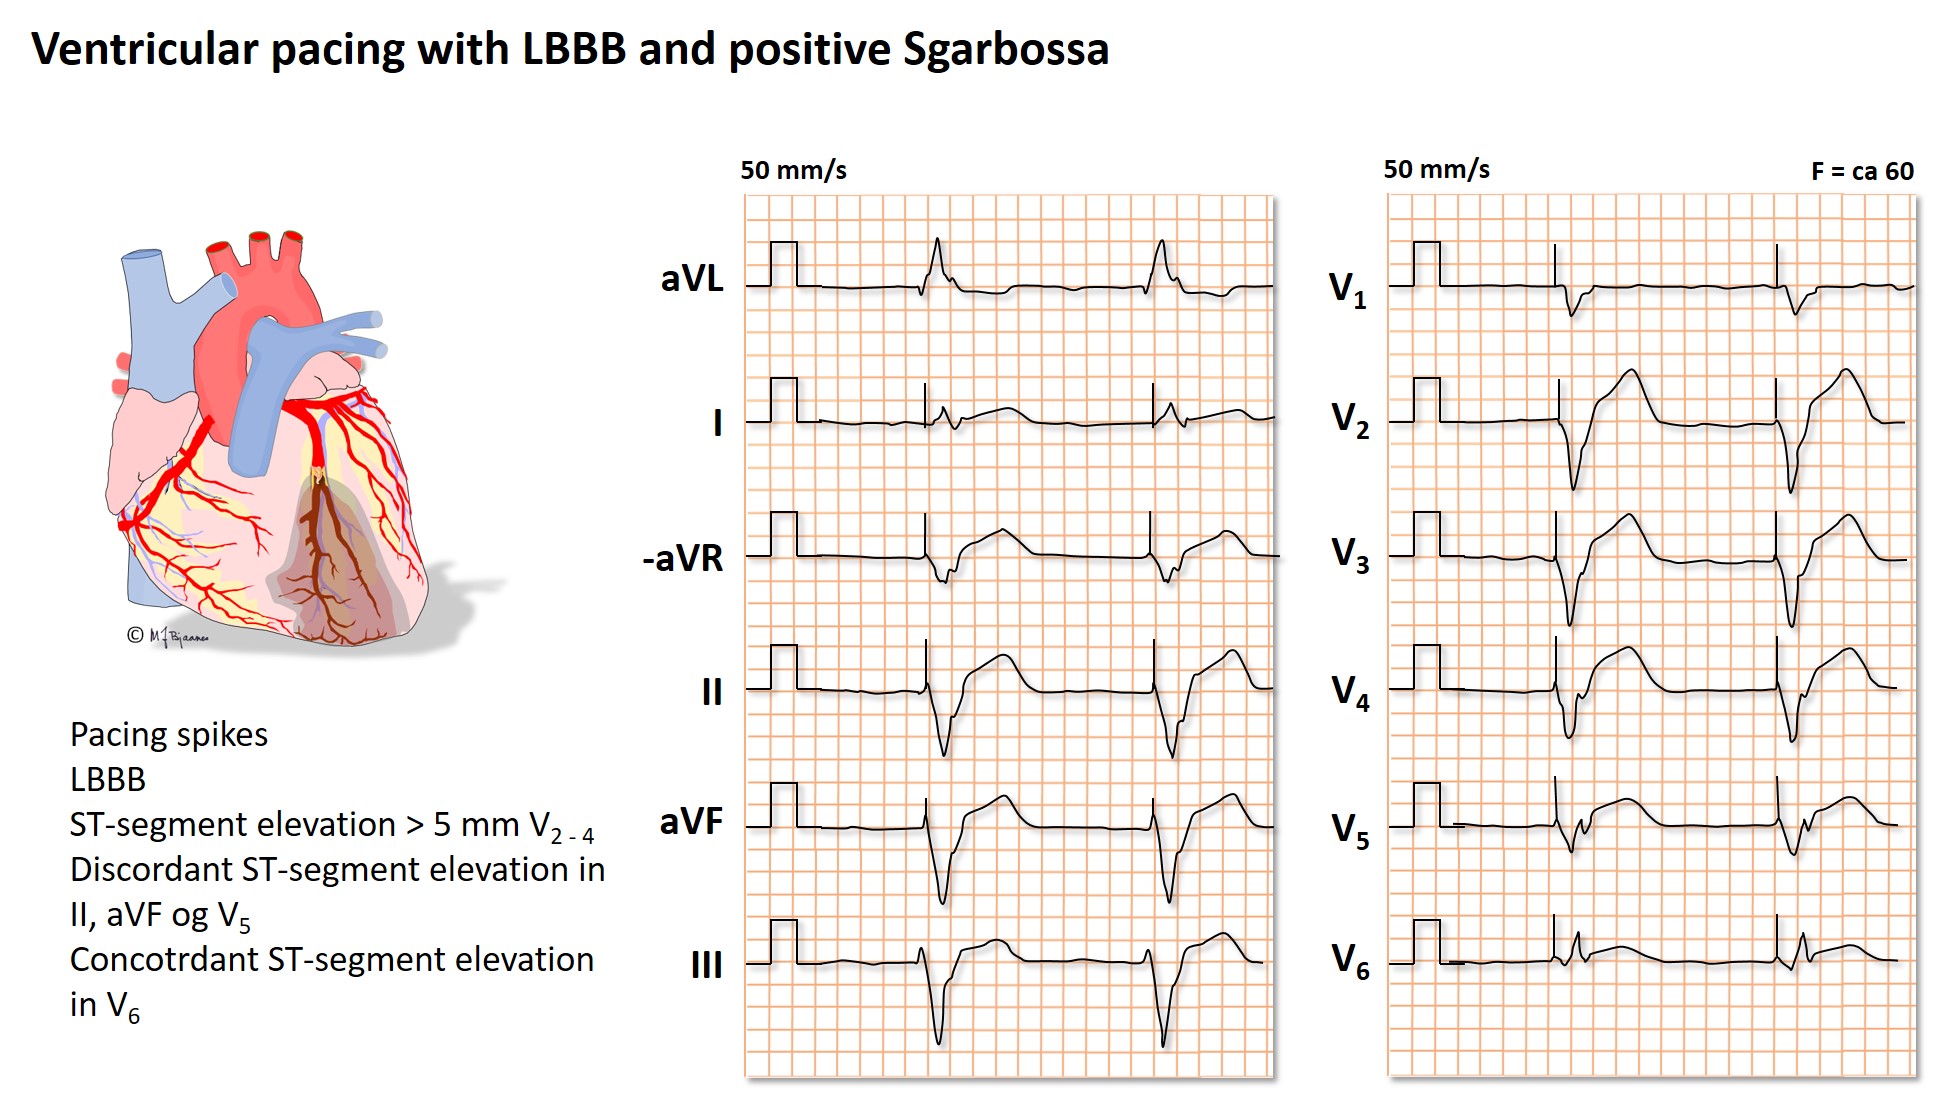
REMEMBER: A left bundle branch block may mask the ECG changes caused by a STEMI. When the clinical picture suggests an infarction, but the ECG merely shows a recent onset left bundle branch block, the patient should be treated as a STEMI patient.
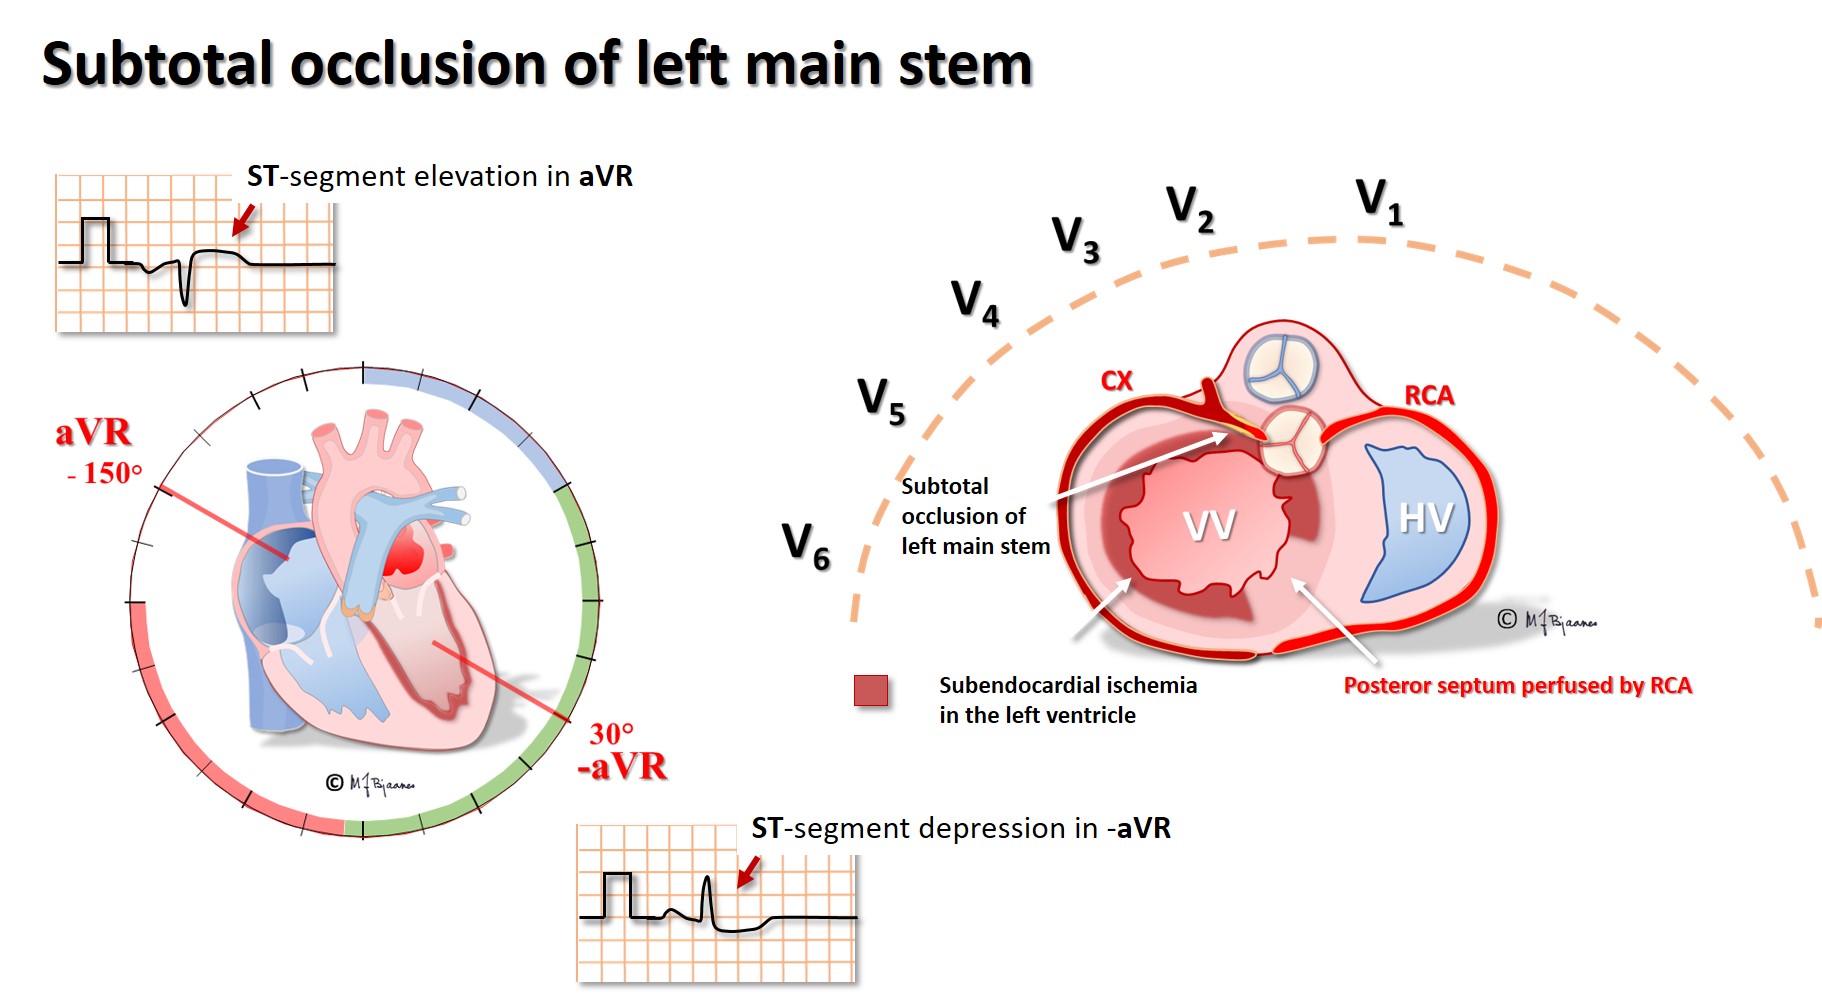
Subtotal occlusion of the left main stem results in almost global subendocardial left ventricular ischemia, and if the main stem occludes completely, infarction related heart failure rapidly occurs. aVR, looking directly into the left ventricle, shows ST elevations, also seen in V1-V2, whereas precordial leads V3-V6 and the standard leads I and aVL have marked ST depressions. Proximal LAD stenosis has been called «the widow maker», and its occlusion result in a similar picture, however, the ST elevation now is usually less in lead aVR than in V1.
When the pain history is short and the ECG changes suggest an inferior wall STEMI, a precordial lead mirror ECG should be recorded. The right-sided leads RV3-4 may show an early, but short-lasting elevation (the thin right ventricle wall results in early transmural cell death, but soon cell signals from the left ventricle dominate the picture and the ST segment may normalize.
Often the ECG allows discrimination between an occluded circumflex artery (CX) from an occluded right coronary artery (RCA). This is useful in the cath lab because the posterior descending artery arises either from the right (right dominant - most often) or the left coronary artery (the circumflex - left dominant), and different angiography catheters are used to reach the right and the left coronary ostium.


In non-STEMI
In NSTEMI there are clinical symptoms + increased s-troponin and +/- ECG changes as development of pathological q waves, loss of R wave amplitudes, transient ST deviation and/or T wave changes. An echocardiographic examination may detect areas with reduced contraction, but it may be difficult to distinguish recent from old abnormalities.
An ongoing infarction may be overlooked when previous ECG abnormalities are present:

An infarction may falsely be suspected in
ECG sequelae of old infarctions
Pathological q waves are the hallmark of a previous infarction. From Part 2 we repeat:

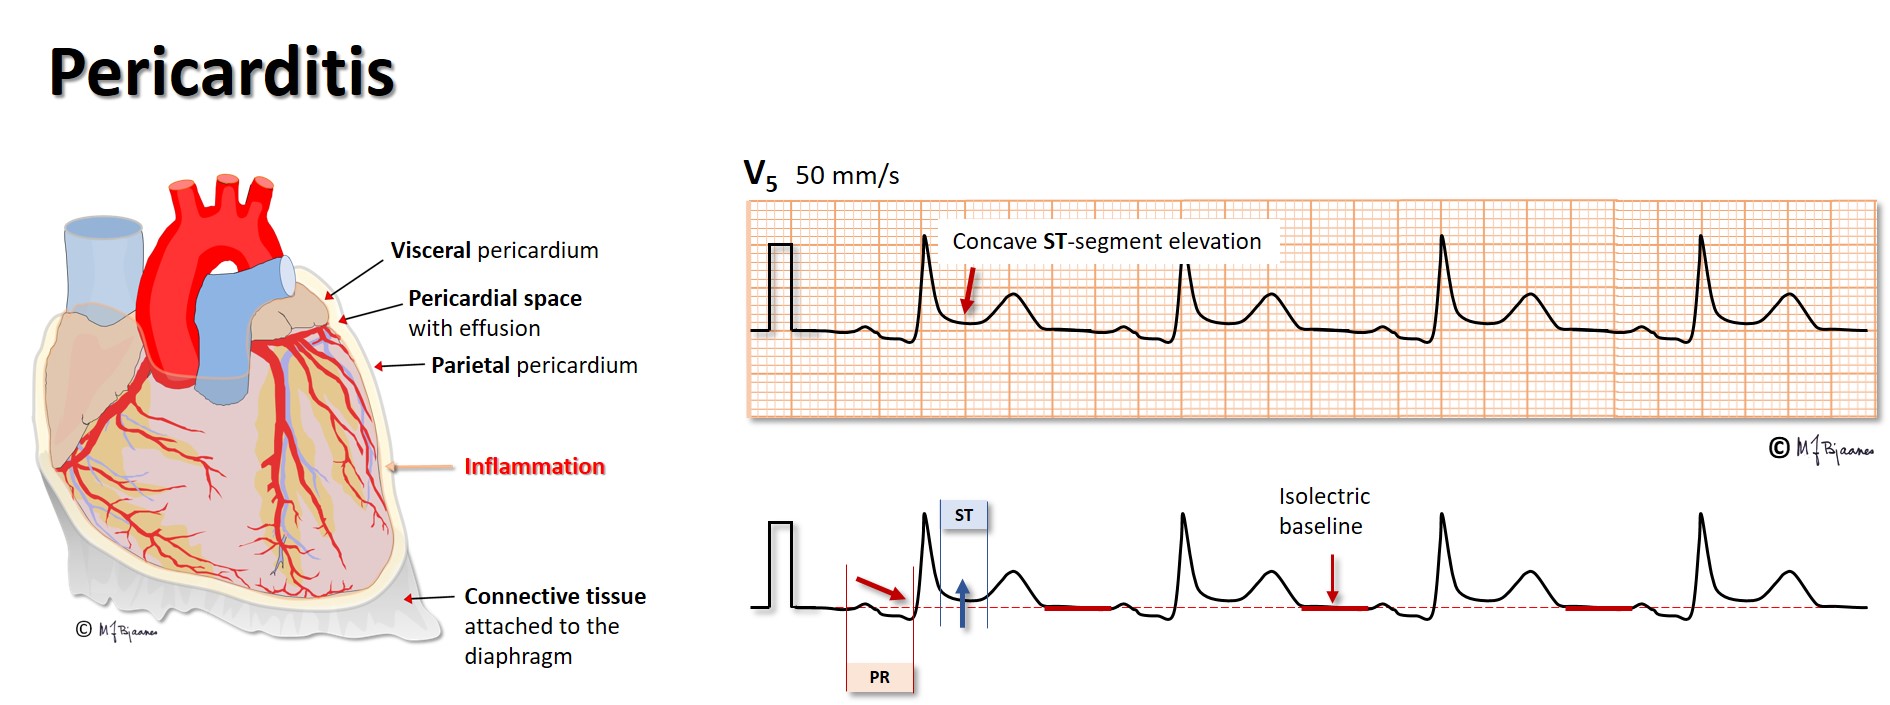
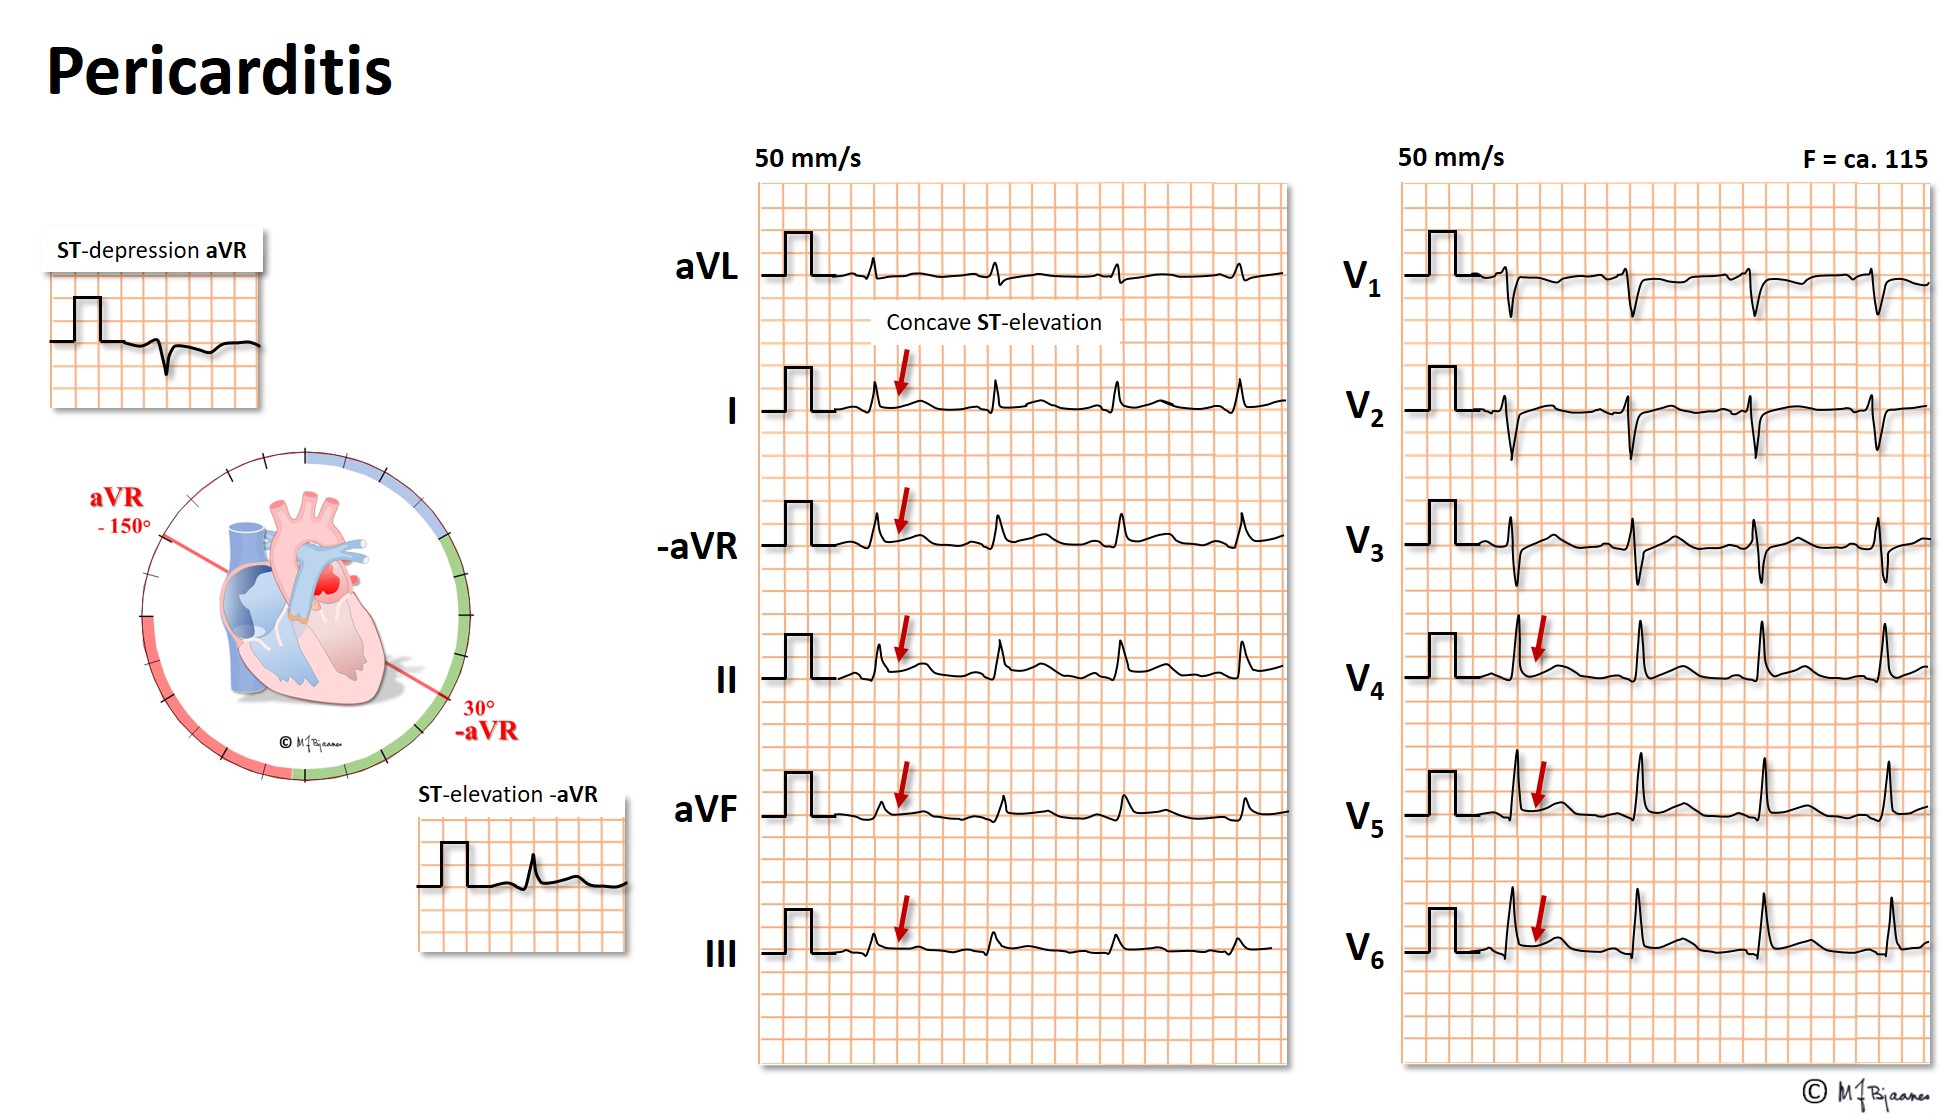
If the pericardial space is filled with fluid (effusion, blood), the filling of the heart in diastole may be compromised by the rigid pericardium, resulting in a characteristic clinical picture with ECG changes:

When a patient with dyspnea presents, an early discrimination between mainly cardiac or pulmonary problems is important. You should, however, always consider alternative causes like fever, anemia, hyperventilation, thyrotoxicosis etc. In heart failure the ECG is rarely completely normal.
Heart failure may rapidly be caused by both far too slow and too fast heart rates, or by longstanding moderate deviation from the required rate, particularly if the heart rhythm is irregular. Examples here are complete AV block with a slow escape rhythm, and recent onset, rapidly conducted atrial fibrillation.
Diastolic dysfunction is appears early in emerging heart failure. Relaxation of the chamber muscles is impaired, the walls stiffen and chamber filling may be reduced. Left ventricular diastolic dysfunction results in increased left atrial afterload (wall stress) and eventually atrial size, and the P wave becomes broader (>0.12 s), and the terminal part of the P wave in V1 (that reflects the left atrium) becomes negative due to more posterior leftward activation. A negative terminal P wave in V1 is considered pathological when the product of the negative signal duration (in ms) and the negative amplitude (in mm, calibrated at 10 mm/mV) is >30. A broad P wave with two peaks may be seen in mitral stenosis, and looks like an M in standard leads, and is coined «mitral P” or “P mitrale»).

In heart failure chambers often dilate with increased end-diastolic volumes. Blood is a poor conductor compared to tissue, and the QRS amplitudes are reduced. Coronary ischemia that often is present, may cause deviation of the ST segments and/or the T waves. Previous myocardial infarctions may cause pathological Q waves in neighbor leads, or they can be suspected due to fragmented QRS or inverted T waves. When myocardial tissue is replaced by fibrosis, QRS complexes may broaden without the patterns of bundle branch block, and that is called intraventricular conduction delay. Usually lead V5 presents the highest R wave, as V6 is lateral to the apex, but when the left ventricle is severely dilated, apex may be displaced more to the left. Then a lead from the posterior axillary line (V7) may present the highest R wave. A left bundle branch block may severely disturb the normal, coordinated septal movements. A completely normal ECG is seldom encountered in heart failure.
The sudden occlusion of a pulmonary artery may result in
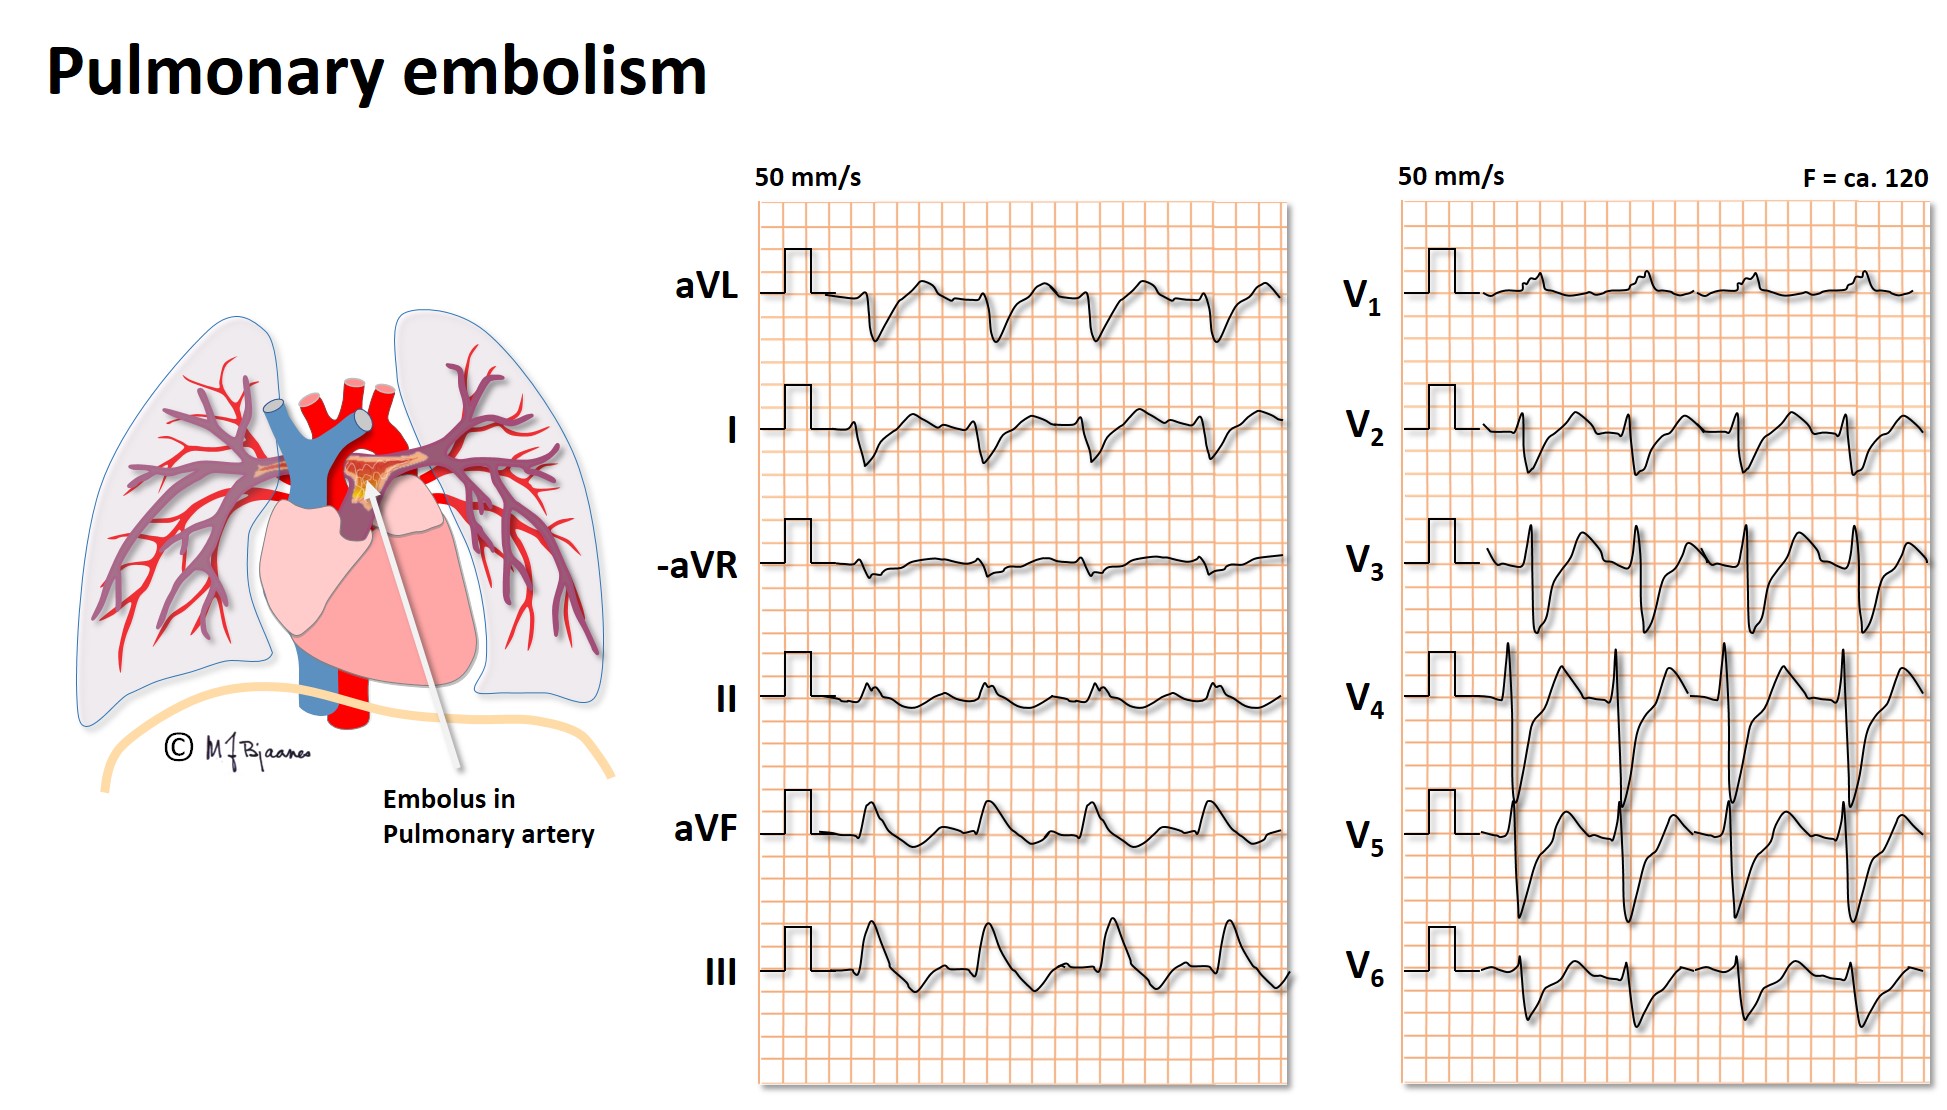
Here we see: Sinus tachycardia, right bundle branch block (RBBB), negative T wave in III, and clockwise rotation of the QRS axis.
Often also we see rightward axis deviation +, right atrial enlargement (P pulmonale), atrial tachyarrhythmias – atrial fibrillation, flutter or atrial tachycardia.
Chronically elevated pulmonary arterial pressure may be transmitted from a failing left side of the heart, or due to increased resistance of the pulmonary arterioles (primary pulmonary hypertension), to occluded pulmonary arteries (chronic embolism), or increased blood flow caused by left to right shunting of blood.
The heart may then compensate by developing right ventricular hypertrophy, with one or more of the following features:


COPD usually has components of asthma, bronchitis and emphysema, each of which may affect the heart and the ECG differently. In emphysema there is loss of lung tissue, expansion of the chest cavity and a more vertical position of the heart. Rightsided cardiac hypertrophy evolves due to increased workload caused by a higher output (hypoxia and an increased vascular resistance). Septum may rotate clockwise, as the right ventricle dilates, and the precordial rS-to-Rs transition moves toward the axilla, or in other cases the transition zone may move in the opposite direction, clockwise, due to right ventricular hypertrophy. Increased pulmonary vascular resistance may reduce left ventricular filling, and this chronic reduction in preload may result in loss of left-sided ventricular muscle mass end hence, less electrical activity. The volume expanded lungs will cover more of the heart surface, and the low conduction of air filled tissue will reduce QRS amplitudes. As a result of all these possible changes, the ECG in advanced COPD is rarely normal, but the picture is heterogenous, although sinus tachycardia, a vertical P wave axis (>70°), right ventricular hypertrophy and either right or left QRS axis deviation are the most common features.

In left ventricular hypertrophy (LVH) the increased muscle mass can be documented by imaging techniques (echocardiography, CT X-ray or MRI) or at autopsy. The common definition of LVH is a left ventricle muscle mass > 116 g/m2 in males and > 104 g/m2 in females. The increased muscle mass is reflected by a thicker wall, a larger chamber, or the two combined. The sarcomeres in each cell increase in number and size, but the cell number remains unchanged.
Physically active persons have larger cardiac muscle mass compared to the sedentary, and may have physiological hypertrophy. In pathological hypertrophy when the left ventricular afterload is increased (aortic stenosis, hypertension) or the patient suffers from a heart muscle disorder (for instance hypertrophic cardiomyopathy), inflammation and fibrosis often occur in addition to the cellular hypertrophy.
In athletes, pathological signs of hypertrophy beyond increased signal amplitudes should raise the suspicion of an underlying muscle disease.
There are many different diagnostic ECG criteria for left ventricular hypertrophy, most of which are old and based upon smaller studies on patients and controls, using autopsy findings, X-ray, echocardiography or MRI as the gold standard. Some formulas are mainly based upon QRS amplitudes, others on signs of remodeling and fibrosis. Generally, the common formulas have a low sensitivity, but a high specificity.
There is poor correlation between left ventricular myocardial mass as shown by echocardiography, and the ECG findings. Several factors contribute to this: the cardiac chambers have a shape that deviates from the ideal that is presumed by the formulas for calculation of mass, and the measurements are operator dependent. Hypertrophy may be unevenly distributed within the heart. The ECG amplitudes are influenced by the electrode placement, the resistance of the skin, the lung volume and the position of the heart within the chest, and, not the least, by the amount myocardial fibrosis. It should thus be no surprise that the echo findings correlate well to MRI findings, whereas ECG better predicts complications as heart failure and death.
It is important to diagnose pathological hypertrophy, because in hypertension the treatment should be intensified, in aortic stenosis the indication for surgery is strengthened, and an athlete with an inherited hypertrophy may be excluded from competitions. For the general practitioner, the simple recording of an ECG is therefore an important diagnostic tool for cardiac hypertrophy.
are the hallmark of left ventricular hypertrophy, and a consequence of an increased cardiac muscle mass. Normally, the total QRS amplitude (R+S wave in a lead) is <2 mV (20 mm) in the standard leads and <3 mV (30 mm) precordially. Well trained healthy young people, especially males, are allowed to have huge QRS excursions provided there are no other signs of pathology; they have an “athlete’s heart”.
QRS amplitudes, however, may be reduced by a number of factors that may mask the diagnosis of LVH:
When the activation of the ventricles is abnormal, as in bundle branch block, ventricular extrasystoles, ventricular pacing and preexcitation.
With increasing cardiac muscle mass, remodeling often occurs, electrical as well as anatomical, changing the QRS axis. Often the axis turns anteriorly, increasing amplitudes in V1-V6, but alternatively, the axis may turn upward posteriorly, resulting in a larger R wave in aVL (up toward left shoulder) and a deeper S in V3 (posterior).
The normal QRS duration is <100 ms. Both inflammation and fibrosis may retard impulse propagation, resulting in an intraventricular conduction delay (QRS 100-120 ms) and usually, q to R wave peak time in V5-V6 is delayed (lasting >50 ms from q wave onset). A delayed impulse propagation may also manifest as fragmentation (notch or peak on R or S waves).
A retarded impulse propagation may occur when the muscle is abnormally thick, but a more important factor is fibrosis. Slow conduction results in reversed repolarization (from endo- to epicardium), as shown by discordance (opposite directions) between the ST segments and T waves in relation to the QRS. Normally there is < 60° difference between the QRS og T wave axes, and when these axes differ more, in the presence of narrow QRS complexes, we should always consider the presence of left ventricle hypertrophy, an old myocardial infarction or cardiomyopathy.

A ventricle with fibrosis is less compliant, and stiffer than normal in diastole. The left atrial afterload is increased, its volume increases and the atrium rotates backward. Often P wave duration is increased, and the posterior forces are seen as a broad, negative terminal P wave in V1 (40ms, 0,1 mV).
The classical textbook description of the ECG in left ventricle hypertrophy, is that of Sokolow and Lyon, assessing anterior left directed electrical forces, that is the sum of the amplitudes of S wave in V1 and the highest R wave in V5 or V6. With standard calibration (10 mm/mV) this sum is normally < 35 mm, but as Norwegians often are heavily built and well trained, the < 37 mm threshold is often used. As the amplitudes are higher in males compared to females, in young vs elderly and fit vs unfit, the pathology threshold is individualized in the clinical practice.

In many, the hypertrophy results in apical rotation upward posterior, and these increased electrical forces are best detected as the R wave in aVL (left shoulder) and the S wave in V3 (posterior). Cardiologists at the Cornell university recommended use of the sum of these values¸ and a “Cornell sum” ≥ 20 mm in females and ≥ 28 mm in males indicate probable LVH.
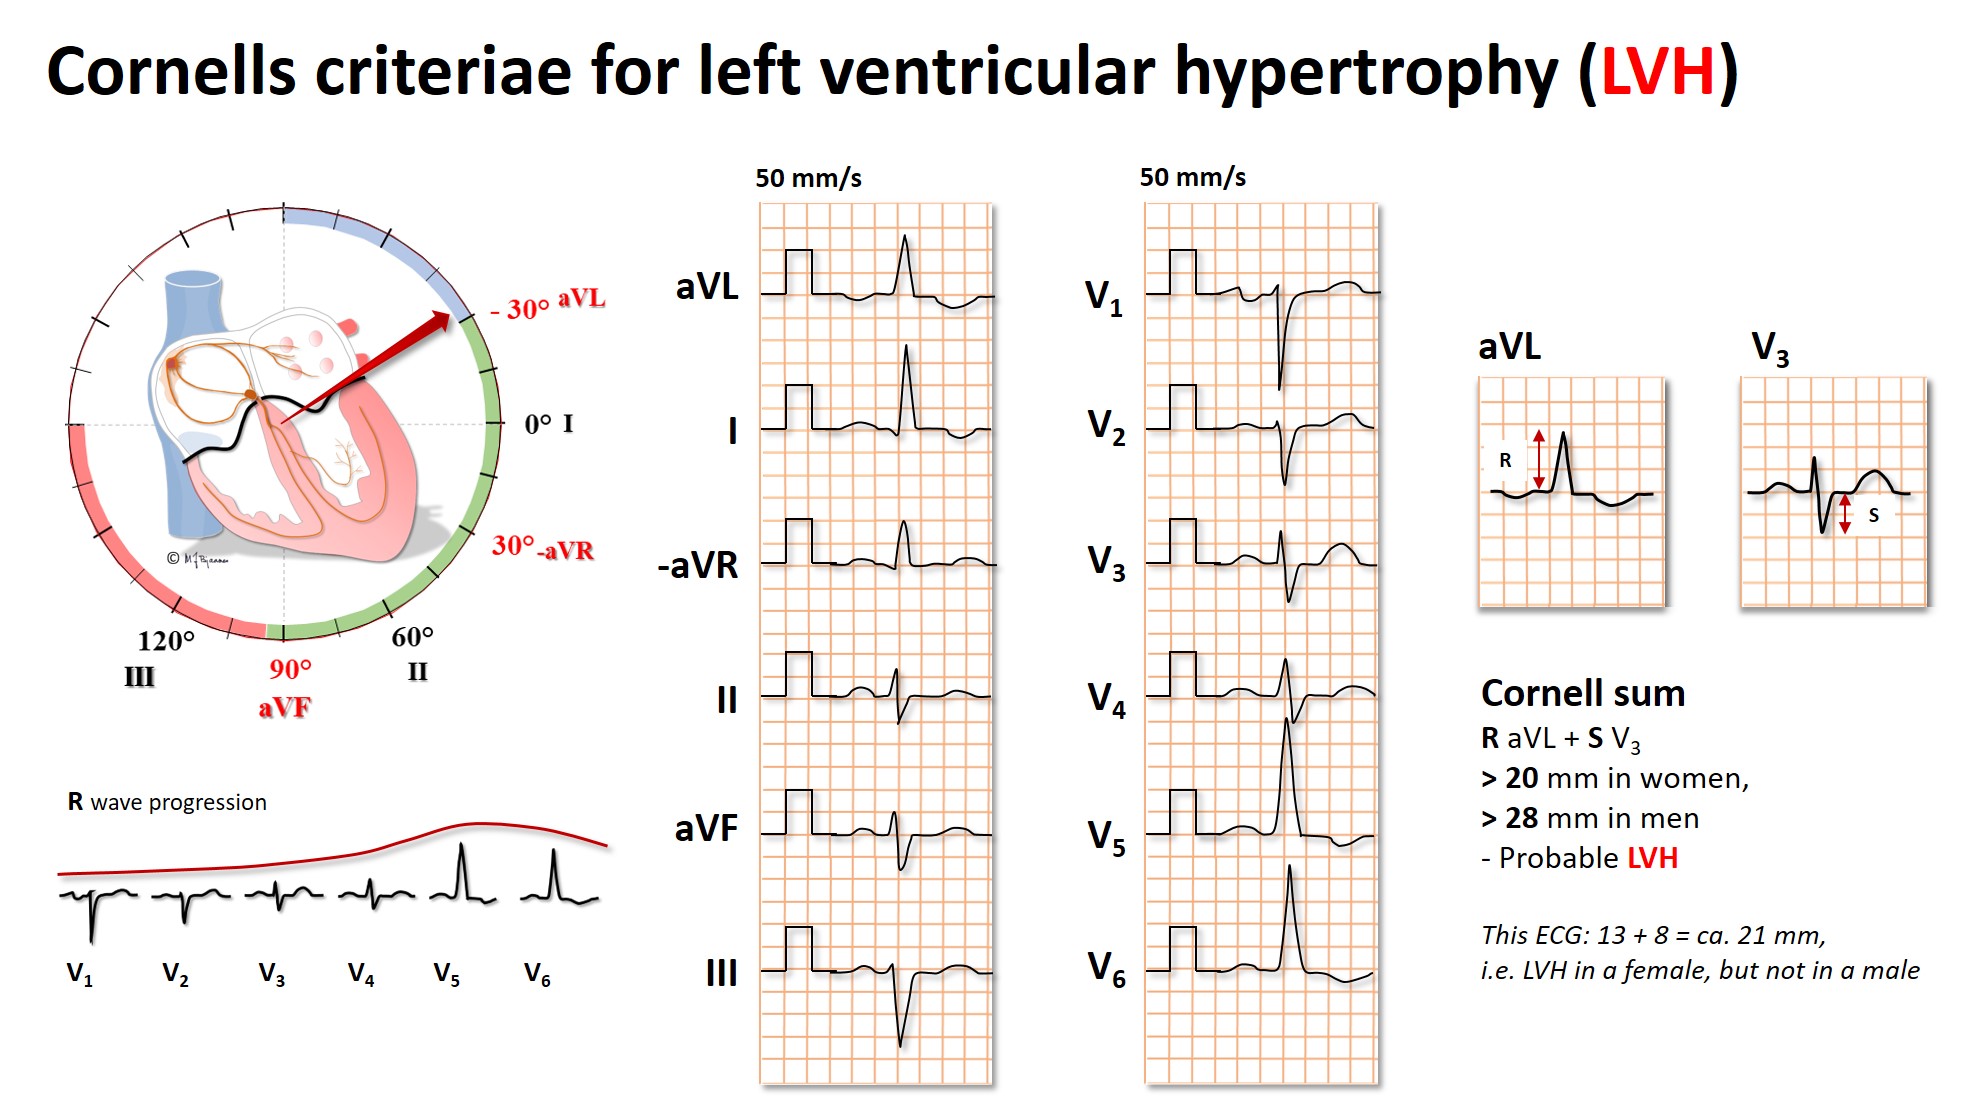
The Cornell sum has a higher sensitivity for the detection of LVH, than that of Sokolow-Lyon, but they do not always overlap, and both methods should be used.
In pathological LVH impulse conduction is retarded. The QRS widens, and this is utilized as the voltage-duration product, where either the Sokolow-Lyon or the Cornell sum is multiplied by the QRS duration in milliseconds. The Cornell product is frequently used in Norway: (R i aVL + S i V3 + 6 mm in females) by QRS duration (ms). A product >2440 suggests LVH.
is a bit more complicated to remember, but is a formula that includes most of the ECG changes in LVH.
| 3 points | An R or an S wave >2 mV (20 mm) in a standard lead An S wave in V1-2 or an R wave in V5-6, >3 mV (30 mm) |
| 3 points | ST-T axes opposite to QRS axis (discordance) |
| 3 points | Negative terminal P in V1 |
| 2 points | Left QRS axis deviation (more to the left upward than -30°) |
| 1 points | QRS width ≥0.09 s |
| 1 points | Time from start of q to R peak >0.05 s |
| Max sum of points is 13, and LVH is probable at ≥5 points | |
In a well-trained person the heart muscle is thicker and the chambers are larger, particularly so for the thin-walled right ventricle. The vagal dominance favors this development through bradycardia and hence, increased stroke volumes. Normally, however, there should be no fibrosis, and hence, no deviation of the ST segment, T wave changes, left axis deviation or signs of left atrial overload.
Sudden unexpected cardiac arrest occurs somewhat more frequently in top athletes than in the general population. Lethal arrhythmias, usually due to hereditary ion channel mutations, or structural anomalies (cardiomyopathies) dominate in the young, while coronary artery disease is the commonest cause among those >35 years.
Hypertrophic cardiomyopathy (HCM) is an important differential diagnosis to athlete’s heart. HCM is caused by mutated/ congenital disturbance of the genes for heart muscle protein production, resulting in a thick, uncompliant left ventricle, usually with interspersed fibrosis. This disorder carries a high risk of sudden cardiac death. When LVH is suspected in a well-trained young person, based on the QRS voltage criteria alone, further investigation is seldom justified, but should be pursued if additional ECG pathology is present, if there is a family history of serious arrhythmias, or the subject has chest pain, palpitations or unexplained fainting spells.
Another important differential diagnosis to athlete’s heart is ARVC (Arrhythmogenic Right Ventricular Cardiomyopathy). This disease is usually caused by mutations in genes that control desmosome protein synthesis; the anchorage and bridge between myocytes. With time, myocytes are replaced by connective tissue and fat cells, both in the right and to a lesser degree, the left ventricle. The patients are at high risk for sudden death at a young age, and strenuous training seems to accelerate the disease process. The diagnosis is based upon a set of criteria (family history, genetic analyses, ECG changes, echo cardiography and MRI).
Hypothermia
Bradycardia, widened QRS complexes and intervals, marked J waves and noise signals from shivering muscles may all be encountered. Arrhythmias like extrasystoles, ventricular tachycardia, ventricular fibrillation or asystole may all occur.
Cerebral hemorrhage and elevated intracranial pressure
may induce ECG changes. Deep broad T waves are typical, as is bradycardia.

Intoxications
Brady- and tachyarrhythmias, widened QRS complexes, ST deviations and changes in QT interval and T wave morphology may all be seen, depending on the toxic agent.
Parkinson’s disease
The tremor may cause muscular noise signals, mostly in the standard leads, as the extremities are most affected by shivering.
Current injury
may occasionally trigger arrhythmias.
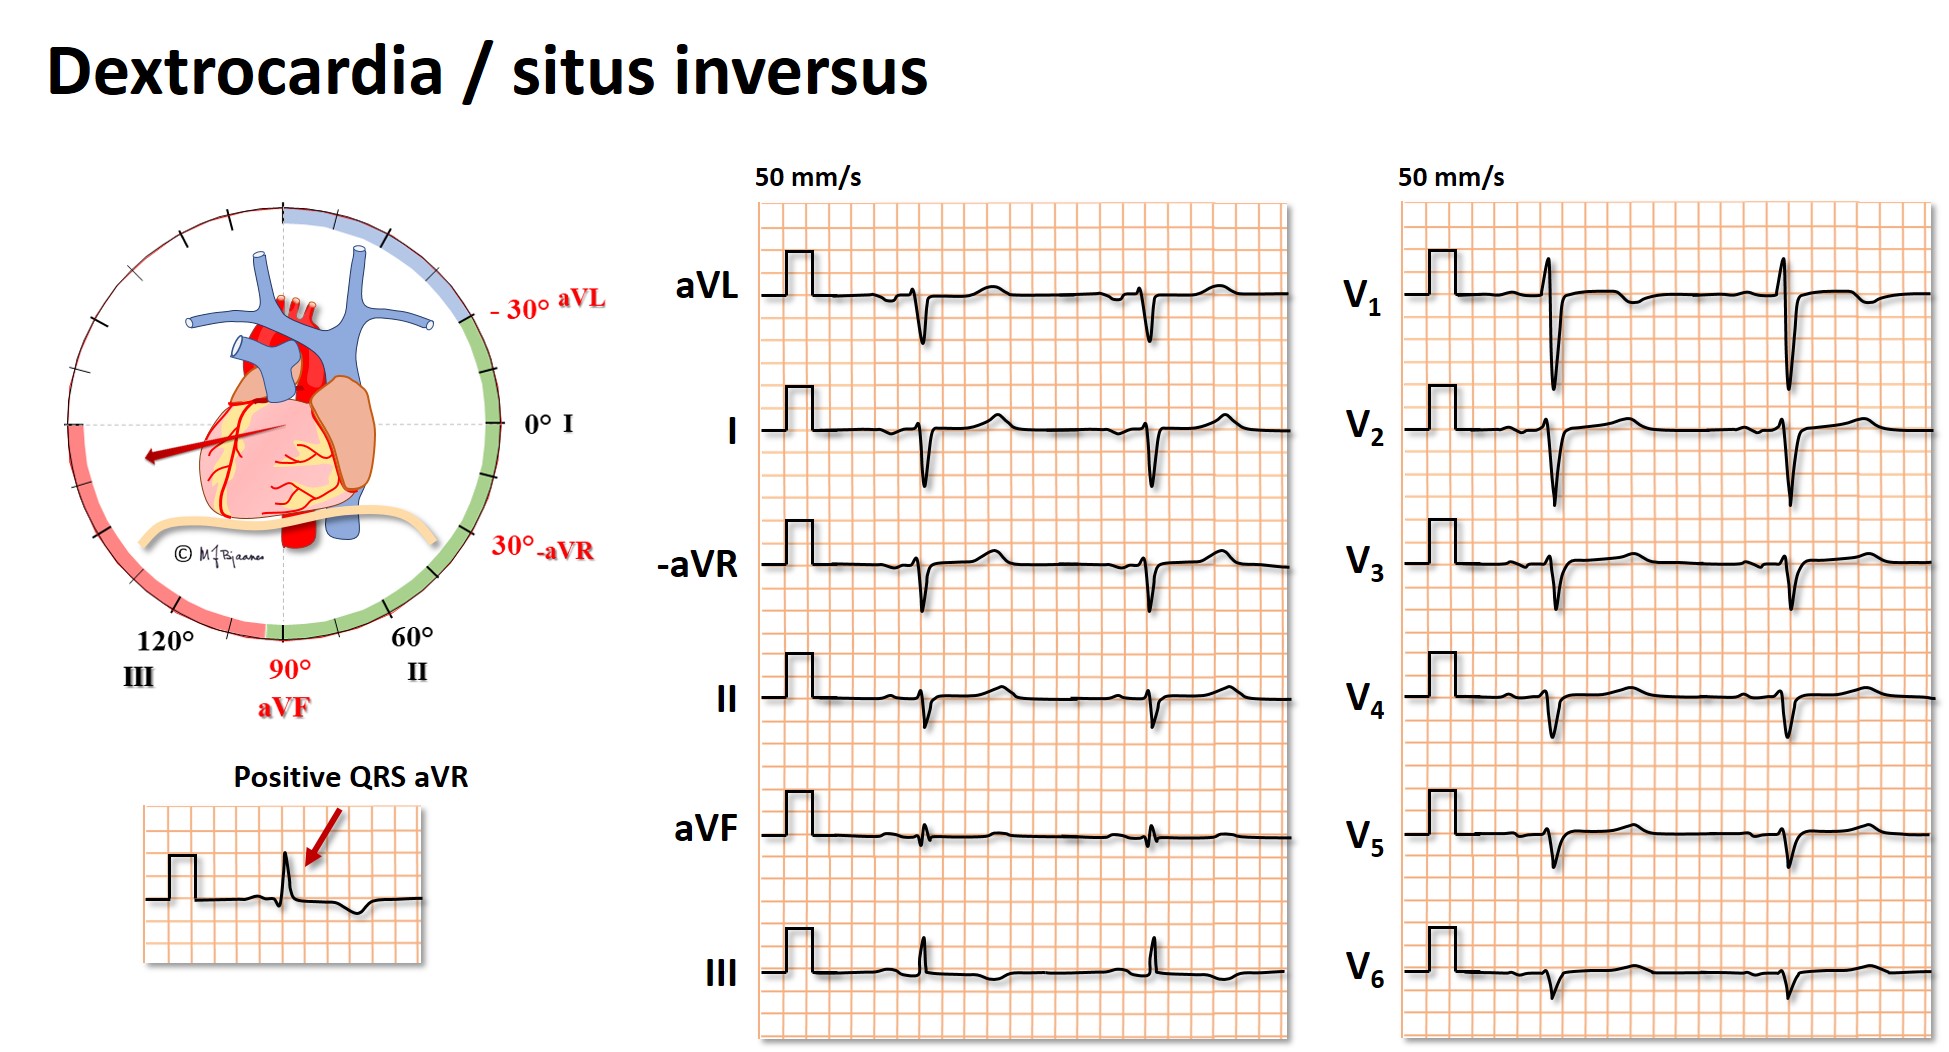
Dextrocardia and situs inversus
Situs inversus occurs in 1 in 12,000, and then the organs in the chest are positioned in a mirror image from their normal positions. Of cause the ECG becomes abnormal, but normalizes when also the electrodes are positioned to give a mirror image. The ECG below shows an extreme right deviation of the QRS axis, a positive QRS in aVR, negative R wave progression in V1 - V6, small amplitudes in V3-V6 and generally negative P and QRS waves in the frontal plane leads.
Congenital cardiovascular disorders in adults
Such patients (GUCH, grown up congenital hearts), may present will a multitude of ECG abnormalities.
Heart transplanted patients
The own heart is removed during surgery, and only a posterior wall remnant of the left atrium is left for connection to the donor heart. The great vessels are correctly coupled: venae cava, pulmonary artery and aorta. The donor sinus node stimulates a resting heart rate of around 100 bpm because it is denervated. We do not know why, but commonly the QRS complex is slightly broader, with an rSr’ pattern in V1 (incomplete right bundle branch block) or occasionally, a complete RBBB. Due to the cardiac denervation cardiac pain cannot be transmitted, and the ECG is important during follow-up.

Erroneous filter setting
This is mainly a problem regarding the 30-40 hertz muscle noise filter. Such filtering is useful in exercise ECG, telemetry and long term ECG recordings, but the filter should not be used for resting 12 lead recording because components of the QRS complex will also be removed. The beginning and end of QRS become less steep, the complex widens slightly and the amplitude in reduced by an average of 20 %. This reduces the sensitivity for detection of left ventricular hypertrophy, but also the pathological splitting of QRS (fragmentation) in myocardial fibrosis may disappear.
Erroneous lead placement
If leads are positioned on the body (truncus) rather than on the extremities, the QRS axis will rotate to the right, and inferior wall infarctions may be overlooked, and healthy persons are at risk for an erroneous diagnosis of an old myocardial infarction.
If distal leg recording is hindered by high boots or tights, placement of the left leg electrode just below the groin is preferable to placement on the iliac crest. The right leg electrode (grounding) however, may be placed anywhere.
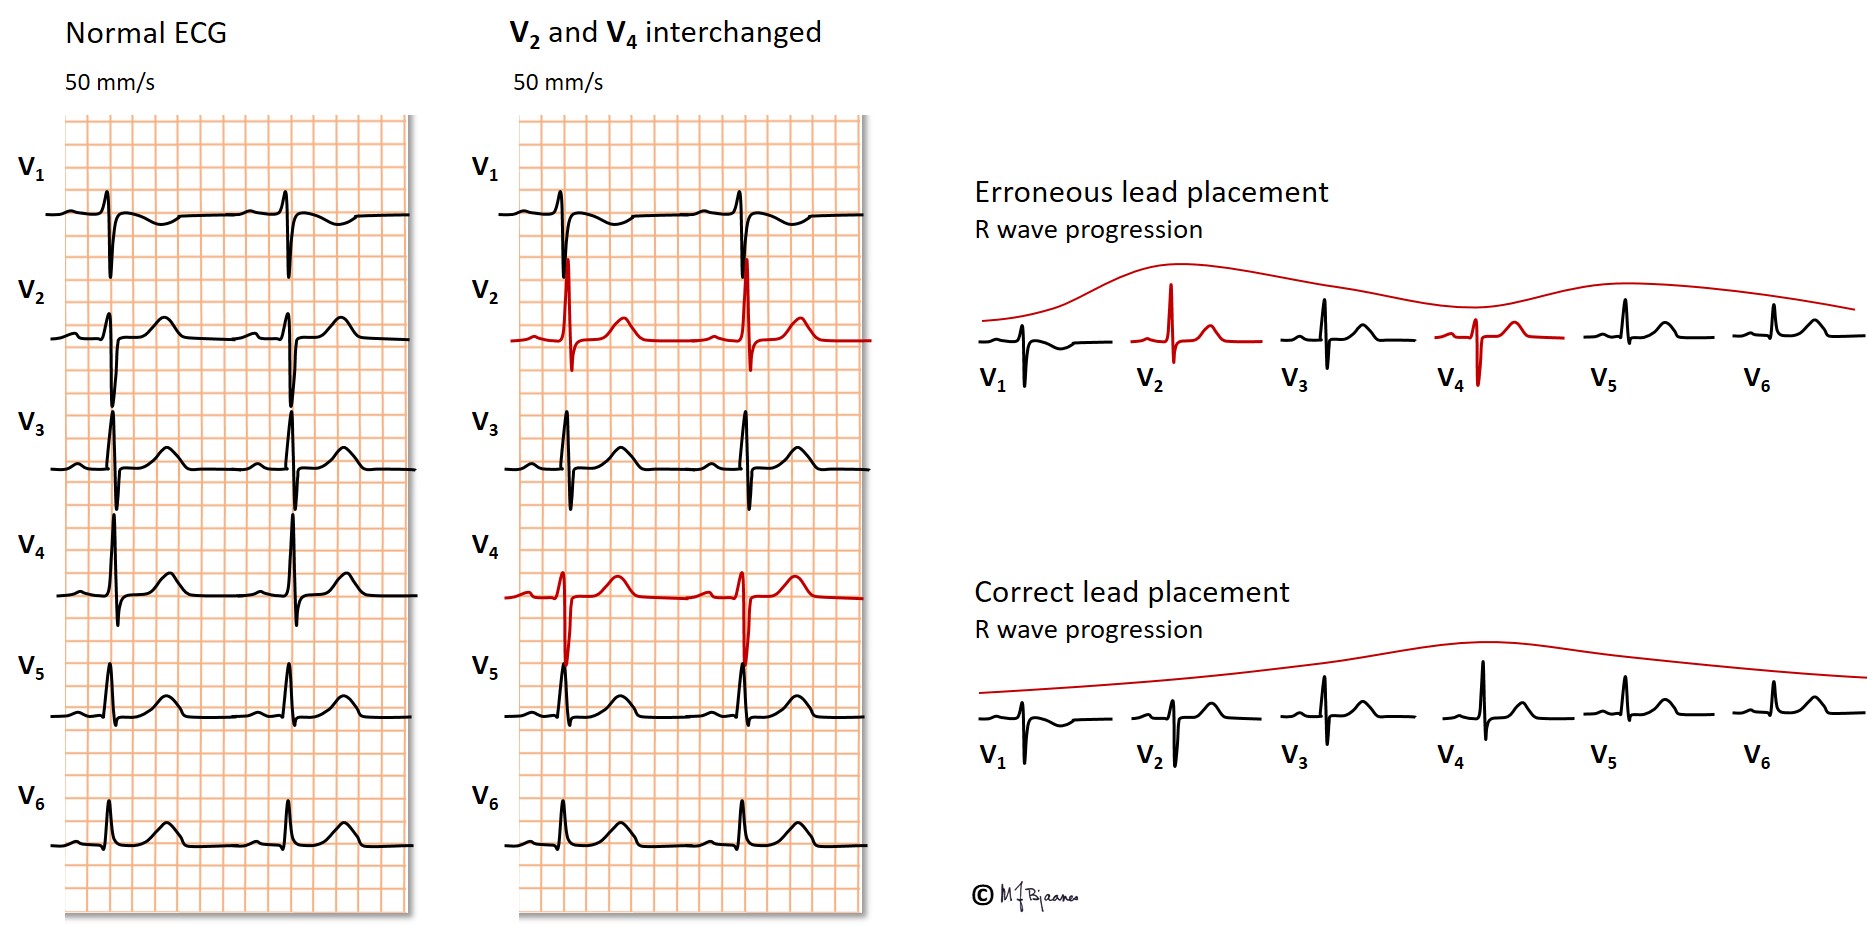
Erroneous placement of the precordial leads (V1-V6) frequently regards their level of height; one intercostal space too high or low interferes with recording the anteroseptal QRS complex as well as the precordial T waves. If eads V5 and V6 are placed too medially, the diagnois of an enlarged heart may be missed.
The standard leads are frequently interchanged, resulting in a bizarre QRS axis. If you look at the «unipolar» leads aVR, aVL and aVF, it is usually easy to see how the leads are positioned.
A loosened electrode
If the skin contact of an electrode is poor, the noise signals are usually obvious, but occasionally they may mimic QRS complexes. However, these signals are usually not found in all channels.
