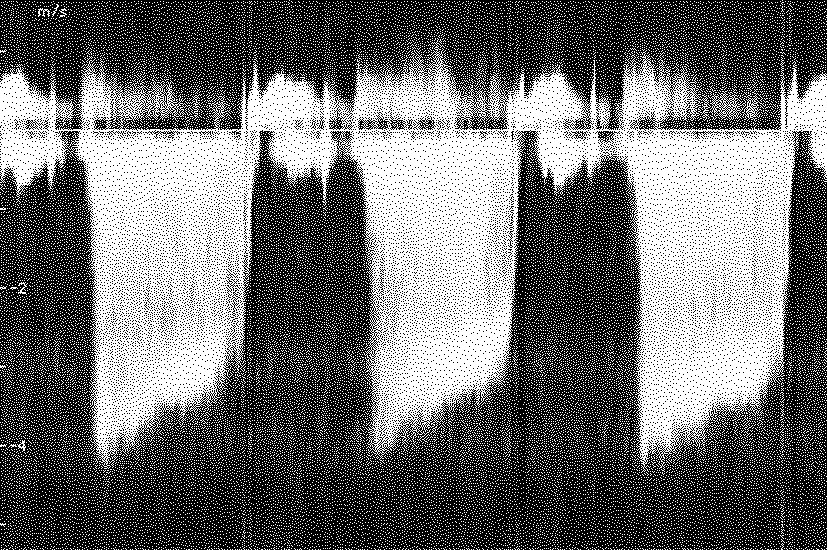
The image below shows the blood flow velocity through the aortic valve. The large negative velocity that starts at -4 and falls to -3 m/s is a jet-stream that leaks backwards through the valve. Notice that you cannot tell how much blood is leaking backwards by looking at this image, you would have to know the size of the area it is leaking through also. With Bernoulli's equation, one can estimate that the pressure difference over the valve falls from 64 to 33 mmHg. Compared with the normal pressure in the heart (80 to 120 mmHg), this indicates that the leakage is significant and that a large part of the pressure is lost during the high-pressure phase.
The Doppler spectrum is measured in two ways: pulsed Doppler (PW-Pulsed wave) and continuous Doppler (CW-Continuous wave). The difference is in the length of the transmitted wave. With continuous transmission, all resolution along the beam (depth) is lost, but the sensitivity improves compared with pulsed Doppler. Moreover, CW has no upper limit for measured velocity. In PW, the upper limit is given by the pulse repetition frequency.